
Page 183 - 2021_02-Haematologica-web
P. 183
ATM-induced mitophagy in MCL
Confocal analysis
Cells were grown in chamber slides, stained with primary antibodies and processed for standard fixation for confocal analysis using an Olympus FV1000 laser confocal microscope with a 40x 1.3-oil immersion lens. All captured images were analyzed using 3I Slidebook 5.5 (SB645.0.0.30) software.
Statistical analysis
All numerical results are presented as mean ± standard error of mean. The statistical significance of differences was analyzed using a Student t-test (paired) or analysis of variance. The statisti- cal computations were conducted with Prism (GraphPad Software, San Diego, CA, USA).
Full details of the methods are available in the Online Supplementary Methods file.
Results
ATM-proficient and -deficient mantle cell lymphoma cell lines display differential sensitivity to FCCP- induced mitophagy.
To determine the role of ATM in mitophagy we used three MCL cell lines (Granta-519, Jeko-1 and Mino). The
ATM-deficient Granta-519 line possesses a single copy of the ATM gene harboring a point mutation within the con- served residues of the kinase domain while both Jeko-1 and Mino cells are ATM-proficient.29,30 These cell lines con- tain the distinguishing t(11;14)(q13;q32) translocation resulting in cyclin D1 (CCND1) overexpression.31 Cells were treated with the mitochondrial uncoupler FCCP to induce mitophagy. Induction of mitophagy was associated
with loss of mitochondrial membrane potential (DΨ both Jeko-1 and Mino cells, while Granta-519 retained
intermediate to high DΨ m
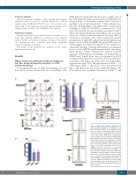
and greater mitochondrial mass (Figure 1A, B). Both basal mROS and global ROS were rel- atively higher in Granta-519 (Figure 1C-E) compared to other MCL cell lines. Typically mitophagy is accompanied by loss of both COXIV and the mitochondrial outer mem- brane protein Tom20. Immunoblot analysis revealed defective FCCP-induced mitophagy in Granta-519 as COXIV and Tom20 levels were not affected by FCCP treatment while they were reduced in FCCP-treated Jeko- 1 and Mino cells (Figure 1F) with <10% cell death (Online Supplementary Figure S1A). Phosphorylation of ATMSer1981 or ATM targets, Kap1Ser824 and Smc1Ser966 was detected in both Jeko-1 and Mino cells but not in Granta-519 (Figure 1F). FCS analysis also confirmed IR-induced ATMSer1981 and
) in m
A
BC
E
D
Figure 1. Mitophagy disparity in ATM-deficient and -proficient mantle cell lymphoma cell lines. (A) Representative flow cytometry (FCS) profile of mantle cell lymphoma (MCL) cell lines (5x10⁶ live cells) treated with FCCP (75 mM for 3 h), stained with TMRE (PE) or Mitotracker deep red (APC) and acquired by a FACSCalibur and analyzed by FlowJo software. (B) Relative mitochondrial mass and membrane potential
) in dimethylsulfoxide (DMSO)-treated (con- m
(DΨ
trol) or FCCP-treated MCL cell lines (geometric mean; n=7; mean ± standard error of mean [SEM]). *P<0.05; **P<0.01; ***P<0.001 showing significant difference from DMSO con- trols. (C) Representative FCS profile of MitoSOX Red-stained, untreated MCL cell lines showing basal levels of mitochondrial reactive oxygen species (mROS). (D) Relative basal mROS in untreated MCL cell lines (geometric mean; n=3; *P<0.05 significant difference between Mino and Granta-519 cells). (E) Representative FCS
DCFDA-stained global ROS levels in MCL cell lines.
profile of H 2
haematologica | 2021; 106(2)
497
