
Page 126 - 2020_09-Haematologica-web
P. 126
C.R. Bolen et al.
observed no difference in prognosis among any of the four mutational subgroups (log-rank P=0.94), although the mutational subsets did perform worse than the unclassi- fied “other GCB” subset (pooled mutational clusters vs. other GCB P=0.021; EZB vs. other GCB P=0.023 ) (Figure 5B).
To recreate the Chapuy classifications, we applied the non-negative matrix factorization (NMF) clustering algo- rithm to the set of mutations overlapping with those reported by Chapuy et al.9 This resulted in five clusters (plus an unmutated cluster: C0) sharing very similar muta- tional profiles and distribution of COO subsets with the clusters of Chapuy et al.9 (Figure 5C and Online Supplementary Figure S2), with the notable exception that CDKN2A/2B (9p21) deletions significantly co-occurred with MYD88 and CD79B alterations, rather than with TP53 alterations as observed in Chapuy et al.9 We observed similar prognostic trends among these subsets, with our clusters G2, G3 and G5 (equivalent to Chapuy C2, C3 and C5) showing significantly worse prognosis when compared with clusters G0, G1 and G4 (Chapuy C0, C1 and C4, respectively) (HR: 1.8; 95%CI: 1.2-2.6; P=0.0033) (Figure 5D) .
Discussion
In this study, we analyzed the mutational profile and prognostic impact of genomic alterations in newly diag- nosed DLBCL patients who were uniformly treated with anti-CD20-based immunochemotherapy [obinutuzumab or rituximab plus cyclophosphamide, doxorubicin, vin- cristine and prednisone (G-/R-CHOP)] in the phase III GOYA trial. Using a well-established, highly validated tar- geted NGS platform, we analyzed SNV and CNA in 465 cancer-related genes and 31 select gene rearrangements in 499 patients. This is the largest prospectively collected dataset in DLBCL so far. These data serve as a valuable resource for understanding the clinical relevance of muta- tions as measured by this platform. Alteration of the BCL2 gene was the only genetic abnormality significantly asso- ciated with shorter PFS independent of molecular or clini- cal factors (treatment arm, COO, IPI, number of planned chemotherapy cycles, and geographic region). This effect was observed for both BCL2 translocations and SNV. The co-occurrence of BCL2 SNV with BCL2 translocations, possibly as a consequence of aberrant somatic hypermu- tation,23 may partially explain the negative prognostic
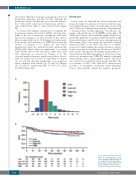
A
B
Figure 4. (A) Distribution of risk scores using the applied Reddy et al.19 prognostic model, and (B) pro- gression-free survival (PFS) by risk group (n=443). int: intermediate.
2304
haematologica | 2020; 105(9)
