
Page 125 - 2020_09-Haematologica-web
P. 125
Somatic mutations in DLBCL
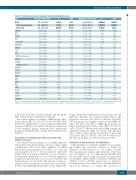
Table 2. Results from prognostic evaluation of prioritized candidate genes.
Gene
BCL2
BCL2 translocation
BCL2 SNV
CREBBP REL CD274 TP53
TP53 SNV TNFRSF14 KMT2D CD58
MYC
MYC translocation
ARID1A CDKN2A
CDKN2A deletion CDKN2B
BCL7A
TNFAIP3
MYD88
B2M
EZH2
BCL6
PIM1
CD79B
CD70
CARD11
TMEM30A
Univariate HR (95%CI)*
1.7 (1.1-2.5)
1.6 (1.0-2.4)
2.2 (1.3-3.8)
1.4 (0.9-2.2)
1.3 (0.8-2.3)
1.6 (0.9-3.2)
1.6 (1.0-2.4)
1.5 (1.0-2.3)
1.2 (0.7-2.1)
1.2 (0.8-1.7)
1.2 (0.7-2.1)
1.6 (0.9-2.8)
1.8 (0.9-3.2)
1.2 (0.6-2.2)
1.7 (1.2-2.5)
1.6 (1.1-2.4)
1.5 (1.0-2.4)
1.1 (0.6-2.1)
0.9 (0.5-1.5)
1.2 (0.8-1.9)
0.8 (0.5-1.4)
0.5 (0.3-1.2)
1.0 (0.7-1.6)
0.8 (0.5-1.4)
0.9 (0.5-1.6)
1.0 (0.5-1.9)
0.5 (0.2-1.1)
0.6 (0.3-1.3)
P FDR 0.012 0.14
0.036 0.096 0.0025 0.041 0.14 0.37
0.32 0.67 0.13 0.37 0.034 0.26 0.044 0.35 0.49 0.74 0.46 0.74 0.59 0.79 0.15 0.37 0.064 0.096 0.66 0.79 0.0056 0.13 0.014 0.058 0.077 0.35 0.81 0.88 0.63 0.79 0.44 0.74 0.52 0.74 0.12 0.37 0.86 0.9 0.48 0.74 0.77 0.88 0.93 0.93 0.076 0.35 0.19 0.43
Multivariate HR (95%CI)† P FDR
2.6 (1.6-4.2) 0.00016
2.5 (1.4-4.2) 0.00095 2.6 (1.5-4.7) 0.0014
0.0037
0.0028 0.022
2.1 (1.3-3.4) 0.0047 0.054
1.9 (1.0-3.4) 0.043 0.25
1.7 (0.9-3.3) 0.13 0.54
1.6 (1.1-2.5) 0.029 0.22
1.6 (1.0-2.5) 0.034 0.18
1.4 (0.8-2.7) 0.26 0.54
1.3 (0.9-1.9) 0.23 0.54
1.3 (0.7-2.4) 0.38 0.62
1.2 (0.6-2.2) 0.60 0.72
1.4 (0.7-2.5) 0.30 0.30
1.2 (0.6-2.4) 0.55 0.70
1.2 (0.8-1.9) 0.46 0.70
1.1 (0.7-1.7) 0.85 0.99
1.1 (0.7-1.7) 0.82 0.85
1.1 (0.6-2.3) 0.68 0.75
1.0 (0.6-1.8) 0.85 0.85
0.9 (0.5-1.4) 0.52 0.70
0.9 (0.5-1.5) 0.63 0.72
0.8 (0.4-1.7) 0.50 0.70
0.8 (0.5-1.2) 0.27 0.54
0.7 (0.4-1.2) 0.21 0.54
0.7 (0.4-1.3) 0.28 0.54
0.7 (0.4-1.4) 0.38 0.62
0.6 (0.3-1.4) 0.22 0.54
0.6 (0.3-1.4) 0.25 0.54
Listed in order of multivariate hazard ratio (HR). Significant alterations on multivariate analysis [false discovery rate (FDR) <0.05] shown in bold. *Adjusted for treatment only. †Adjusted for treatment arm, International Prognostic Index, cell-of-origin, number of planned chemotherapy cycles, and geographic region. CI: confidence interval.
both in the total FMI evaluable patients and among the ABC subtype (Online Supplementary Table S4).
In a survival analysis according to COO subtype, BCL2 translocations (HR: 2.3; 95%CI: 1.3-4.2; P=0.0049; FDR, 0.017) were significantly associated with shorter PFS inde- pendent of clinical factors in the GCB subtype, while none of the identified genetic alterations were significantly prognostic within the ABC subtype (Online Supplementary Table S5).
Correlation of combined genomic risk model with clinical outcomes
We evaluated the performance of a combined genomic risk model for predicting clinical outcomes using a single comprehensive NGS assay. When applying a modified mutational model generated by Reddy et al.,19 the risk scores ranged from -3 to 7, with most patients centered at 0 (Figure 4A). Low-risk was defined by a score <0 (n=112), low-intermediate-risk with a score 0 (n=215), high-inter- mediate-risk patients had a score >0 and <3 (n=107), and high-risk had a score ≥3 (n=29). This genomic scoring sys- tem provided clear separation between the low/low-inter- mediate and high/high-intermediate groups (Figure 4B).
Using a simple dichotomization of the score into low- and high-risk subgroups, the overall univariate HR for the prognostic score was 0.61 (95%CI: 0.42-0.88; P=0.0087). The risk groups were highly correlated with COO sub- types, and after correcting for COO, the model was no longer significant in the entire cohort (HR: 0.77; 95%CI: 0.49-1.2; P=0.27). When tested within COO subtypes, no significant prognostic signal was found, although there was a trend for added prognostic information among the GCB subset (HR: 0.5; 95%CI: 0.24-1.04; P=0.06) but not the ABC subset (HR: 1.2; 95%CI: 0.66-2.32; P=0.5).
Validation of new molecular classifications
Although there is no publicly available tool for classify- ing samples into molecular subtypes as defined by Schmitz et al.8 and Chapuy et al.,9 we sought to validate these classifications using an approximation of their clus- ters. For Schmitz et al.,8 we approximated the EZB, BN2, N1 and MCD clusters using each cluster’s founder alter- ations (EZH2 or BCL2; BCL6 or NOTCH2; NOTCH1; and MYD88, L265P or CD79B, respectively; see Methods). Prevalence of these four clusters was consistent with those reported by Schmitz et al.8 (Figure 5A); however, we
haematologica | 2020; 105(9)
2303
