
Page 95 - 2019_03-Haematologica-web
P. 95
RED score and hepcidin:ferritin in lower-risk MDS
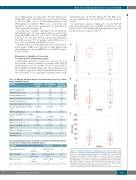
versus 1822 pg/mL in responders; P=0.47) (Figure 1C). Using ROC curves, thresholds were subsequently defined as 4 for the RED score, 9 for hepcidin:ferritin ratio and 2000 pg/mL for GDF-15. ROC curves, sensitivity and specificity for these three parameters are presented in Online Supplementary Figure S4.
cidin:ferritin ratio >9 (P=0.01) (Figure 2B). The RED score was not significantly associated with response duration (P=0.4).
In multivariate analysis, taking into account GDF-15 level, hepcidin:ferritin ratio and IPSS classificaiton, only GDF-15 level >2000 pg/mL and hepcidin:ferritin ratio ≤9 predicted shorter response (Table 3).
A
B
C
Figure 1. Biological markers of dyserythropoiesis and correlation with response to erythropoiesis-stimulating agents. Response was defined accord- ing to the International Working Group 2006 criteria (IWG 2006) for hematolog- ic improvement-erythroid. (A) Mean RED score before treatment for patients who did have a response (yes) or did not have a response (no). Non-responders had higher RED scores (P=0.01). (B) Mean hepcidin:ferritin ratio in patients who did or did not have a response; the hepcidin:ferritin ratio was lower in non- responders (P=0.04). (C) Mean GDF-15 level in patients who did or did not respond to erythropoietin-stimulating agent treatment (P=0.4).
In multivariate analysis, only RED score ≤4 and hep- cidin:ferritin ratio >9 were significantly associated with better HI-E (OR 4.02, 95% CI: 1.0-22.7, P=0.05, and OR 4.44, 95% CI: 1.23-18.2, P=0.02, respectively) (Table 2B). The HI-E rate was 39% in patients with a RED score >4 versus 75% in patients with a RED score ≤4.
Patients with a low hepcidin:ferritin ratio (≤9) had rela- tively higher sEPO levels than those with higher hep- cidin:ferritin ratios (mean sEPO 108 versus 65 IU/L, respec- tively, P=0.003).
Biomarkers of duration of response to erythropoiesis-stimulating agents
The median duration of response to epoetin zeta was 26.1 months, being 8 months in patients with GDF-15 >2000 pg/mL versus 35 months for those with GDF-15 ≤2000 pg/mL (P=0.0008) (Figure 2A). The median duration of response in patients with a hepcidin:ferritin ratio ≤9 was 10 months versus 30 months in patients with a hep-
Table 2A. Baseline biological markers associated with response to erythro- poiesis-stimulating agents.
Variables
Hb level ng/mL, mean
sEPO level IU/L, mean
Ferritin (ng/mL), mean
Transferrin saturation (%), mean
Hepcidin (ng/mL), mean
Responders Non-responders Univariate
Hepcidin/ferritin (x100), mean
n=33
9.4
65.5 613 36.2 39.3
9
15 (45%)
1822
11 (33%) 1.26
4.9
15 (45%)
6.5
7 (21%)
n=37
9.4
117 618 50.7 30.2
6
27 (73%)
2180
20 (54%) 1.57
6.2
23 (62%)
7.6
25 (67%)
analysis (P) 0.37
0.001 0.62 0.04 0.45 0.04 0.006
0.47
0.046 0.4 0.05 0.029
0.15
0.37
Patients with hepcidin:ferritin ≤9; n (%)
GDF-15 (pg/mL) mean
Patients with GDF-15 >2000 pg/mL; n (%)
Ogata score, mean
RED score at T0, mean
Patients with RED score >4;
n (%)
RED score+ Ogata score, mean
Patients with >2
mutations; n (%)
Table 2B. Multivariate analysis of predictors of erythroid hematologic improve- ment (HI-E) to erythropoiesis-stimulating agents.
Variables
Hepcidin/ferritin (x100)
GDF-15 (pg/mL)
RED score at T0
>9 ≤9 (ref)
OR (95%CI) P 4.44 [1.23-18.2] 0.02
≤2000 >2000 (ref)
1.00
2.86 [0.80-11.6]
1.00
0.11
≤4 >4 (ref)
4.02 [1.0-22.7] 0.05
1
Hb: hemoglobin; sEPO: serum erythropoietin; GDF-15: growth-differentiation factor-15: T0: base- line.
haematologica | 2019; 104(3)
501
