
Page 94 - 2019_03-Haematologica-web
P. 94
S. Park et al.
(40%) (decrease of transfusion of at least 4 RBC concen- trates/8 weeks or transfusion independence). The median duration of response was 26.1 months. In three, MDS pro- gressed to acute myeloid leukemia. Twelve patients died (including 3 with acute myeloid leukemia and 1 with pro- gression of MDS). The median overall survival was 41 months with a median follow-up of 15.5 months. No grade >2 adverse events were reported. No cases of hyper- tension or deep venous thrombosis were reported. No patients had a hemoglobin greater than 13g/dL.
Flow cytometry results and correlation between iron parameters
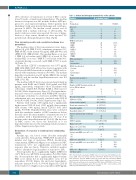
The median values of the iron parameters were: hemo- globin 9.5 g/dL (IQR 8.9-10), transferrin saturation 39% (IQR 28-56), serum ferritin 411 ng/mL (IQR 258-831) and sEPO 49 U/L (IQR 25-122). The median Ogata score was 1 (IQR 1-2) at baseline and 2 (IQR 1-2) at week 12. The median RED score was 7 (IQR 5-7) at baseline (with 90% of patients having a score ≥3), and 5 (IQR 4.75-7) at week 12 (Table 1).
The median GDF-15 concentration was 1971 pg/mL (IQR 1236-2860). GDF-15 level was lower in patients with IPSS low-risk MDS than in those with int-1 MDS and cor- related with transferrin saturation (P<0.003). The median hepcidin concentration was 27 ng/mL (IQR 14-42; normal 1.3-26.4) and the median hepcidin:ferritin ratio was 5.5 (IQR 1.9-11.85).
The median GDF-15 levels were elevated particularly in patients with RARS and CMML (3163 pg/mL and 3520 pg/mL, respectively, compared to those in patients with other types of MDS (RA, RCMD, RAEB-1, Wilcoxon test P=0.02) (Online Supplementary Figure S2). The hepcidin:fer- ritin ratio was not correlated with WHO 2008 classifica- tion despite a tendency to a lower ratio in RARS. The hep- cidin:ferritin ratio was inversely correlated with GDF-15 levels (R2=0.245, P=0.04), Online Supplementary Figure S3).
Patients with ferritin >400 ng/mL had a significantly higher mean GDF-15 level (3011 pg/mL) than patients with ferritin <400 ng/mL (mean GDF-15 level 2018 pg/mL, P=0.005). Hepcidin:ferritin ratios were correlated with the cumulative number of RBC transfusions before the trial onset: the mean number of transfusions was 2.3 in patients with a hepcidin:ferritin ratio >9 versus 5 in patients with a hepcidin:ferritin ≤9 (P=0.03). On the basis of ROC curves, we chose the threshold of 9 for hepcidin:ferritin ratio for the remaining statistical analyses (Online Supplementary Figure S4A).
Biomarkers of response to erythropoiesis-stimulating agents
Baseline age, sex, blood counts (absolute neutrophil count, platelets, hemoglobin), WHO 2008 classification, number and type of mutations, IPSS-R classification, serum ferritin, sEPO levels, Ogata score and previous RBC transfusions were not significantly associated with response (data not shown). Therefore, mutation analysis failed to identify biological markers of response to ESA.
Non-responders had a significantly higher sEPO level (117.3 IU/L versus 65.5 IU/L in responders, P=0.001) (Table 2A). Non-responders had a significantly higher baseline RED score (mean 6.2 in non-responders versus 4.9 in responders, P=0.01) (Figure 1A) and lower hepcidin:fer- ritin ratio (mean 4.8 versus 9, P=0.04) (Figure 1B). GDF-15 levels tended to be higher in non-responders (2180 pg/mL
Table 1. Clinical and biological characteristics of the patients.
Variables
Sex Female/male
N. or median (range) %
Age years
≤65 69
39/31
56%/44%
65-70 >70-75 >75-80 >80
WHO classification RCMD
RARS
RCUD
RAEB-1 Del5 q MDS-U CMML
IPSS classification Low
Intermediate
IPSS-R classification Very low
Low
Intermediate
High
Transfusion dependency Yes
No
Number of RBC transfusions/8 weeks before ESA treatment
2or3
3-6 46 5-7 11
9.5 (6.7-10.7) 49 (6.4-490) 418 (32-2566) 40 (16.76-95) 27 (7.95-163) 5.5 (0.76-25.2)
44 62%
26 38% 1971 (879-11788)
1 (0-4)
2 (0-4) 7 (2.3-7)
40 57% 30 43%
5 (2.2-7)
7 10 14 20 12 17 31 44
22 31.5% 14 20% 19 27 4 6% 2 3% 3 4%
6 8.5%
43 61%
27 39%
13 19% 47 67% 9 13%
1 1
20 28%
50 72%
15 21
Hb at inclusion (g/dL) sEPO level (IU/L)
Serum ferritin (ng/mL) Transferrin saturation (%) Hepcidin (ng/mL) Hepcidin/ferritin x 100
Patients with hepcidin: ferritin ≤9 Yes
No
GDF-15 (pg/mL)
Ogata score at T0 Ogata score at week 12 RED score at T0
Patients with RED score at T0 >4 Yes
No
RED score at week 12
Patients with RED score at week 12 >4 32 78%
Yes 32 46% No 38 54%
RED score + Ogata score 7 (1.3-11)
(median, range)
WHO: World Health Organization; RCMD: refractory cytopenia with multilineage dys- plasia; RARS: refractory anemia with ring sideroblasts; RCUD: refractory cytopenia with unilineage dysplasia; RAEB-1: refractory anemia with ring sideroblasts; MDS-U: myelodysplastic syndrome-unclassifiable; CMML: chronic myelomonocytic leukemia; IPSS: International Prognosis Scoring System; IPSS-R: Revised IPSS; RBC: red blood cell; ESA: erythropoietin-stimulating agent; Hb: hemoglobin; sEPO: serum erythropoietin; GDF-15: growth-differentiation factor-15: T0: baseline.
500
haematologica | 2019; 104(3)
