
Page 221 - 2019_03-Haematologica-web
P. 221
T-cell receptors following SCT
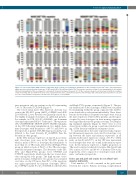
Figure 3. T-cell receptor alpha (TRα) repertoire composition in the context of T-cell depletion. Distribution of TRα clonotypes in the CD8+ naïve (left) and memory (right) repertoires of patients from four groups: UD-ATG, mmUD-ATG, UD-noATG and Haplo-PTCy. The patients’ repertoires on day 60 post transplantation (60) and day 180 post transplantation (180) are mapped for each patient. Frequent clonotypes (frequency >1% of TRα reads) are shown in color. Each pair of identical clonotypes on day 60 and day 180 are shown in the same color (separately for the naïve and memory repertoire). All clonotypes with a TRα read frequency between 0.1% and 1.0% are colored in white; frequencies less than 0.1% are in gray. n.a.: not available.
and Haplo-PTCy groups, respectively] (Figure 3). The spa- tial distributions of the clonotypes, which were visualized by normalizing within the group, supported the distribu- tions described for each patient individually. These distri- butions showed that no frequent clonotypes were seen in the naïve repertoire of UD-noATG-patients, and the space occupied by rare clonotypes in their memory repertoire was larger than that in the groups receiving T-cell-deplet- ing transplant regimens (Figure 4). There were too few observations within one group to perform statistical test- ing of TRα diversity within the treatment cohorts.
To understand how the naïve repertoire helps repopu- late the memory repertoire, we looked for clonotype over- lap between the naïve and memory repertoires in all patients. In the naïve repertoire, a mean of 31.9% of TRα reads on day 60 and 29.7% on day 180 were represented by clonotypes that were also found in the memory reper- toire. In the memory repertoire, a higher proportion of TRα reads consisted of shared clonotypes. On days 60 and 180, a mean of 51.0% and 63.4% of memory TRα reads, respectively, were composed of clonotypes found in the naïve and memory repertoire.
Donor age and graft cell counts do not affect T-cell receptor-α diversity
Total number of T cells contained in the graft varied between the cohorts. Patients receiving a haploidentical
were present in only one patient on day 60, representing 7.4% of TRα reads (TCR_008) (Figure 3).
The lowest mean naïve TRα repertoire diversity was seen in the UD-ATG group (d60 Ds=0.880519 and d180 Ds=0.915102). Lower diversity was generally caused by a few highly dominant clonotypes in individual patients. For example, in TCR_001 (D =0.530540), one dominant
s
clonotype represented 68.2% of the naïve TRα repertoire
(AA: CAYSPYDKVIF; TRAV38-2/DV8, TRAJ50). Similarly, on day 180 following transplantation, two highly domi- nant clonotypes with frequencies of 49.7% and 29.4% in the repertoire of patient TCR_056 disproportionately con- tributed to the lower diversity (Ds=0.665819) than the diversity in other groups.
In the TRα memory repertoire on day 60, most domi- nant clonotypes were seen in the UD-ATG group, in which a mean of 59.0% of clonotypes had frequencies of more than 1% of TRα reads, followed by the Haplo-PTCy group, in which a mean of 54.6% of the TRα was repre- sented by frequent clonotypes. The diversities of the UD- ATG and Haplo-PTCy groups were 0.949665 and 0.958078, respectively, which were the two lowest diver- sities among the four groups. The high amount of fre- quent clonotypes within these two groups was sustained over time: on day 180 more than 50% of the repertoire was again represented by frequent clonotypes [58.0% (Ds=0.957527) and 61.8% (Ds=0.928325) for the UD-ATG
haematologica | 2019; 104(3)
627
