
Page 218 - 2019_03-Haematologica-web
P. 218
C.S. Link-Rachner et al.
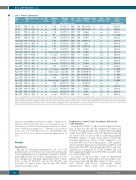
Table 1. Patients’ characteristics.
Group Patient Disease Age Sex CMV- Treatment Transplant Stem T-cell Conditioning Donor Donor Donor Post
ID# ID#
UD-ATG TCR_001
UD-ATG TCR_003 UD-ATG TCR_023 UD-ATG TCR_041 UD-ATG TCR_056 mmUD-ATG TCR_013 mmUD-ATG TCR_038 mmUD-ATG TCR_048 mmUD-ATG TCR_054 mmUD-ATG TCR_055 UD-noATG TCR_005 UD-noATG TCR_008 UD-noATG TCR_017 UD-noATG TCR_019 UD-noATG TCR_027 Haplo-PTCy TCR_012 Haplo-PTCy TCR_014 Haplo-PTCy TCR_026 Haplo-PTCy TCR_036 Haplo-PTCy TCR_049 SIB-noATG TCR_002 SIB-noATG TCR_011 SIB-noATG TCR_024 SIB-noATG TCR_040
Status status atSCT
regimen cell depletion allele-matching source
ALL 47
T-ALL 34 AML 54 CLL 71 AML 68
B-ALL 63 AML 49 AML 63 AML 68 AML 63
B-NHL 61 CLL 73 AML 46
MDS 64 AML 72 AML 62 AML 21 MDS 65 AML 51 AML 65 AML 53 AML 50 MDS 63
T-NHL 49
m neg
m pos m neg m pos m pos f pos f neg m pos m neg f neg f pos m pos m neg m neg f pos m neg m pos f pos f neg m pos f pos f pos m pos m pos
m neg
1st CR
1st CR
1st CR
PR
1st CR
2nd CR
1st CR
1st CR
1st CR Induction failure 2nd relapse stable
1st CR
no response 1st CR
> 2nd relapse Induction failure 2nd relapse 2nd CR Induction failure 1st CR
1st CR
no response 3rd relapse
1st relapse
UD-SCT 10/10
UD-SCT 10/10 UD-SCT 10/10 UD-SCT 10/10 UD-SCT 10/10 UD-SCT 9/10 UD-SCT 9/10 UD-SCT 9/10 UD-SCT 9/10 UD-SCT 9/10 UD-SCT 10/10 UD-SCT 10/10 UD-SCT 10/10 UD-SCT 10/10 UD-SCT 10/10 Haplo-SCT Haplo-SCT Haplo-SCT Haplo-SCT Haplo-SCT SIB-SCT 10/10 SIB-SCT 10/10 SIB-SCT 10/10 SIB-SCT 10/10
SIB-SCT 10/10
PBSC ATG
PBSC ATG PBSC ATG PBSC ATG PBSC ATG PBSC ATG PBSC ATG PBSC ATG PBSC ATG PBSC ATG PBSC no PBSC no PBSC no PBSC no PBSC no
BM PTCy BM PTCy BM PTCy BM PTCy BM PTCy
PBSC no PBSC no PBSC no
BM no
PBSC no
regimen
TBI 12 Gy/Eto
TBI 12 Gy/Eto Flu/Bu 8 Flu/Bu 8 Flu/Treo Flu/TBI 8 Gy Bu/Cy Flu/TBI 2Gy Flu/Bu 8 Flu/Mel Flu/Bu 8 Flu/Bu 8 Flu/Bu 8 Flu/Bu 8 Flu/Bu 8 Flu/Cy/TBI 2Gy Flu/Cy/TBI 2Gy Flu/Cy/TBI 2Gy Flu/Cy/TBI 2Gy Flu/Cy/TBI 2Gy Flu/TBI 8Gy Flu/Bu 8 Flu/Bu 8 Bu/Cy Flu/Bu 8
Sex CMV-Status Age
m neg 23
m pos 34 m neg 23 f pos 55 m pos 51 f pos 32 m pos 19 m pos 50 m pos 48 f neg 46 f neg 27 m neg 23 m neg 42 m neg 20 m pos 41 m pos 33 f neg 44 m pos 29 m neg 25 m pos 38
grafting immunosuppression
Mtx, CsA
Mtx, CsA
Mtx, CsA CsA, MMF Mtx, CsA Mtx, CsA Mtx, CsA Mtx, CsA Mtx, CsA Mtx, CsA Mtx, CsA Mtx, CsA Mtx, CsA Mtx, CsA Mtx, CsA Tac, MMF Tac, MMF Tac, MMF Tac, MMF Tac, MMF
SIB-noATG TCR_063 AML 59
f pos f neg f neg m neg f pos
60 CsA 49 Mtx, CsA 67 Mtx, CsA 45 Mtx, CsA 64 Mtx, CsA
ALL: acute lymphoblastic leukemia; T-ALL: T-cell acute lymphoblastic leukemia; B-ALL: B-cell acute lymphoblastic leukemia; AML: acute myeloid leukemia; CLL: chronic lymphocytic leukemia;MDS:myelodysplastic syndrome;NHL:non-Hodgkin lymphoma;T-NHL:T-cell non-Hodgkin's lymphoma;B-NHL:B-cell non-Hodgkin lymphoma;m:male;f:female;CR:complete remission; PR: partial remission; UD-SCT: unrelated donor stem cell transplant; Haplo-SCT: haploidentical donor stem cell transplant; SIB-SCT: identical sibling donor stem cell transplant; PBSC: peripheral blood stem cells; BM: bone marrow; ATG: antithymocyte globulin; PTCy: post-transplantation cyclophosphamide; TBI: total body eradication; Eto: etoposide; Flu: fludara- bine; Bu: busulfan; Mtx: methotrexate; CsA: cyclosporine; Tac: tacrolimus; MMF: mycophenolate mofetil: pos: positive; neg: negative.
.
analyzed using ANOVA and Dunnett's multiple comparison test. Simpson’s diversity index (Ds) was used as a general measure of diversity, as previously described; this index is known to be insen- sitive to differences in sample sizes.18,21 Differences in Ds between groups were tested with Wilcoxon tests or Kruskal-Wallis rank sum tests. P=0.05 was considered statistically significant for all tests.
Results
Engraftment
On day 60 following transplantation, 19 out of 25 patients had recovered leukocyte counts. The median day of neutrophil granulocyte engraftment (defined as 0.5x10⁹ neutrophils/L) was day 20 post transplantation. In con- trast, lymphocytes remained significantly below control levels on day 60 (P<0.001) and day 120 (P<0.01), and recovered to control levels only by day 180 (Online Supplementary Figure S2A).
Suppression of naïve T cells in patients with in vivo T-cell depletion
Assessment of CD4+ T cells revealed suppressed num- bers on days 60, 120 and 180 compared to controls (all P<0.001). Notably, patients who received ATG had signif- icantly lower CD4+ counts on day 180 than those who did not receive ATG as part of their conditioning regimen (P<0.001). Analyses of CD4+ T-cell subsets revealed the sustained suppression of naïve T cells compared to con- trols (P<0.001). The lowest mean naïve CD4+ numbers were found in both groups receiving ATG and PTCy at all time points (P<0.001). In all groups, the CD4+ T-cell com- partment was dominated by CCR7–CD45RA– EM cells with significantly higher values (P<0.001) for patients than for controls (Figure 1A).
In contrast to the low CD4+ counts in transplanted patients, the CD8+ T-cell numbers from all samples were increased on days 120 and 180 compared to those of con- trols (P<0.05 and P<0.01, respectively) (Online Supplementary Figure S2B). The proportion of
624
haematologica | 2019; 104(3)
