
Page 205 - 2019_03-Haematologica-web
P. 205
IL6ST variants lead to aberrant T-cell phenotype
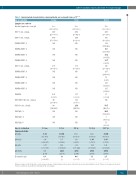
Table 1. Immunological characterization, immunoglobulin and eosinophil values of PP498L.
Age at evaluation
Lymphocyte subsets
Absolute lymphocyte count, g/L CD3+ T cells, cells/mL
CD4+ T cells, cells/mL CD45RA+CCR7+, % CD45RA-CCR7+, % CD45RA-CCR7-, % CD45RA+CCR7-, %
CD8+ T cells, cells/mL CD45RA+CCR7+, % CD45RA–CCR7+, % CD45RA–CCR7–, % CD45RA+CCR7-, %
1.8 mo 9.9 yr
8000 3600 (3500-13100) (1100-5900) 6480 2772 (2300-7000) (700-4200) 4640 1584 (1700-5300) (300-2000) ND ND
ND ND ND ND ND ND
2080 1008 (400-1700) (300-1800) ND ND
ND ND ND ND ND ND
12.7 yr
3500 (1000-5300) 2555 (800-3500) 1610 (400-2100) 61.2 (57.4-84.9) 6.9 (11.3-26.7) 18.2 (3.3-15.2) 13.7 (0.4-2.6) 945 (200-1200) 29.7 (28.4-80.6) 5.5 (1.4-5) 12.3 (6.2-29.3) 29.7 (9.1-49.1) 1.7 (0.9-3.4) ND
56.7
(226-370)
90.5
(75.2-86.7) 6 (4.6-10.2) 5.1 (3.3-9.6)
12.7 yr
15.80
(7.7-15.1)
1.86
(0.7-1.5) 1.46 (1.08-3.25) 6974 (2-696) 2.5 (0.0-0.5)
CD4/CD8 2.23 1.57
CD56+CD16+ NK cells, cells/mL CD19+ B cells, cells/mL CD27–IgD+, %
CD27+IgD+, %
CD27+IgD, %
Age at evaluation
Immunoglobulin
IgG (g/L) IgM (g/L) IgA (g/L) IgE (IU/L)
Eosinophils (g/L)
1.8 mo
5.19
(7.5-15.5) 0.24 (0.12-0.87) 0.073 (0.06-0.58) 6.71 (2-34) 6.3 (0.02-0.85)
(1.3-6.3) (0.9-2.6) 480 324 (200-1400) (90-900) 880 216 (549-1225) (228-516) ND ND
ND ND ND ND
6.5 yr 9.9 yr
19.80 13.10 (6.5-14.1) (7.3-13.5) 1.07 1.23 (0.55-2.1) (0.8-1.5) 1.28 0.94
(0.83-2.17) (0.70-2.22)
2433 2788
(2-307) (2-696) NA 0.6 (-) (0.0-0.5)
12.1 yr
12.60 (7.7-15.1) 1.61 (0.7-1.5) 1.12
(1.08-3.25)
2788
(2-696)
1.1
(0.0-0.5)
Reference ranges for B-cell absolute counts and percentages of naïve/memory subsets were obtained from a previously published cohort.46 Values out of range are shown in bold. mo: months; yr: years; ND: not determined; NA: not available.
haematologica | 2019; 104(3)
611
