
Page 122 - 2019_03-Haematologica-web
P. 122
E. Brissot et al.
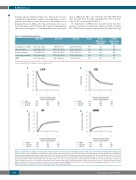
the three groups (Table 2, Figure 1C). This result was also confirmed in multivariate analysis showing that poor cyto- genetics and disease status (first and second relapse versus primary refractory AML) were the only risk factors associ- ated with increased RI, whereas KPS, age at transplantation and time from diagnosis to transplantation were protective
factors (HR=0.76, 95% CI: 0.64-0.90, P=0.001; HR=0.92, 95% CI: 0.87-0.98, P=0.007; and HR=0.98, 95% CI: 0.97- 0.99, P<10-3, respectively) (Table 4).
No differences in NRM were noted between the three groups of patients in univariate analysis (Table 2, Figure 1D). Multivariate analysis demonstrated that patients’ age
Table 2. Transplantation outcomes. Haplo PTCy
UD 10/10
28% (25-30.9)
34.7% (31.5-37.8) 46.3% (43.1-49.4) 25.7% (23.1-28.5) 16.4% (14-18.8)
UD 9/10
22.2% (17.6-26.7)
27.6% (22.7-32.5) 51.1% (45.7-56.3) 26.7% (22.2-31.4) 16% (12.1-19.9)
P value
NS
NS NS NS NS
P value Haplo versus UD 10/10
NS
NS NS NS NS
P value Haplo versus UD 9/10
NS
NS NS NS NS
Leukemia-free survival
Overall survival Relapse incidence Non-relapse mortality GRFS
22.8% (16.3-29.2)
29.3% (22.1-36.6) 52% (44.3-59.1) 25.3% (19.2-31.8) 16.3% (10.6-21.9)
Data are presented as percentage with 95% confidence intervals in brackets. GRFS: graft-versus-host disease-free, relapse-free survival; haplo: haploidentical; PTCy: post-transplant cyclophosphamide; NS: not significant; UD: unrelated donors.
AB
CD
Figure 1. Leukemia-free survival, overall survival, relapse incidence and non-relapse mortality in patients with acute myeloid leukemia allografted during active disease. (A) The 2-year probability of leukemia-free survival (LFS) was 22.8% (95% CI: 16.3-29.2) in the group transplanted from a haploindentical donor with post- transplant cyclophosphamide (Haplo) versus 28% (95% CI: 25-30.9) in the 10/10 HLA-matched unrelated donor group (UD 10/10), and 22.2% (95% CI: 17.6-26.7) in the 9/10 HLA-mismatched unrelated donor group (UD 9/10) (P=NS). (B) The 2-year probability of overall survival (OS) was 29.3% (95% CI: 22.1-36.6) in the Haplo group versus 34.7% (95% CI: 31.5-37.8) in the UD 10/10 and 27.6% (95% CI: 22.7-32.5) in the UD 9/10 groups (P=NS). (C) The 2-year cumulative incidence of relapse (RI) was 52% (95% CI: 44.3-59.1) in the Haplo group versus 46.3% (95% CI: 43.1-49.4) in the UD 10/10 and 51.1% (95% CI: 45.7-56.3) in the UD 9/10 groups (P=NS). (D) The 2-year cumulative incidence of non-relapse mortality (NRM) was 25.3% (95% CI: 19.2-31.8) in the Haplo group versus 25.7% (95% CI: 23.1- 28.5) in the UD 10/10 and 26.7% (95% CI: 22.2-31.4) in the UD 9/10 groups (P=NS).
528
haematologica | 2019; 104(3)
