
Page 121 - 2019_03-Haematologica-web
P. 121
Haploidentical versus unrelated donor HSCT for active AML
0.99, P=0.03). Of note, no effect was observed for donor type (Table 4).
The OS rate at 2 years did not differ between the three groups of patients (29.3% in the Haplo PTCy group versus 34.7% in the UD 10/10 group and 27.6% in the UD 9/10 group, P=NS) (Figure 1B). These results were confirmed by multivariate analysis. In the latter, three predictive fac-
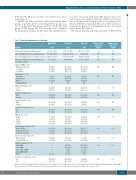
Table 1. Baseline characteristics of patients.
Number
Follow-up in months, median (range)
Age at transplant in years, median (range) Yearoftransplantinyears,median(range) 2014(2009-2015)
tors were associated with lower OS: disease status (sec- ond relapse versus primary refractory AML), poor cytoge- netics and the patient being positive for cytomegalovirus, whereas KPS ≥90 at transplant, RIC versus MAC and short- er time from diagnosis to transplantation were associated with a better OS (Table 4).
We did not find any differences in terms of RI between
Haplo PTCy 199
16 (2.1 - 63.5)
UD 10/10 1111
18.1 (0.6- 113)
52.4 (18.1-77.3) 2011(2007-2015) 6.8 (2-474.8)
501 (45.1) 491 (44.2) 119 (10.7)
40 (10.2) 235 (59.8) 118 (30) 718
412 (49) 619 (61)
587 (52.9)
523 (47.1)
769 (72.8) 287 (27.2)
925 (87.7)
130 (12.3)
308 (29.1) 81 (7.6) 305 (28.8) 366 (34.5)
465 (41.9) 380 (34.3) 263 (23.7)
72 (6.5) 1039 (93.5)
325 (30) 484 (44.6) 54 (5) 20 (2) 25 (2.3)
265 (24.2)
830 (75.8)
UD 9/10 383
22.9 (1.8 - 104.9)
51.7 (18-76) 2011(2007-2015) 8.1 (2.1-121.4)
141 (36.8) 190 (49.6) 52 (13.6)
15 (9.3) 98 (60.9) 48 (29.8) 222
143 (39.7) 217 (60.3)
209 (54.6)
174 (45.4)
247 (66) 127 (34 )
313 (83.7)
61 (16.3)
89 (24.2) 38 (10.3) 128 (34.9) 112 (30.5)
144 (37.7) 128 (33.5) 110 (28.8)
30 (7.8) 353 (92.2)
113 (29.7) 161 (42.4) 27 (7.1) 11 (2.9) 7 (2)
54 (14.2)
327 (85.8)
Haplo versus UD 10/10 P value
0.05
NS <10-3
NS
NS
NS
0.01
NS
<10-3
<10-3
<10-3
<10-3
<10-3
<10-3
<10-3
Haplo versus UD 9/10 P value
0.02
NS <10-3
NS
NS
NS
0.03
NS
NS
NS
<10-3
<10-3
<10-3
<10-3
<10-3
51.9 (18.2-77.8)
Time from diagnosis in transplant in years
in months (range)
Status of AML, n (%) Primary refractory 1st relapse
2nd relapse
Cytogenetics, n (%) Favorable Intermediate Adverse Unknown/failed
KPS at transplant, n (%) <90%
≥90%
Patients’ gender, n (%) Male
Female
Donors’ gender, n (%) Male
Female
Female D to male R, n (%) No
Yes
CMV status, n (%) D-/R-
D+/R-
D-/R+
D+/R+
Conditioning regimen, n (%) Myeloablative
Reduced intensity Sequential strategy
Source of stem cells, n (%) Bone marrow
Peripheral blood
GvHD prophylaxis, n (%) CSA+MTX
CSA+MMF Tacrolimus+MMF CSA+MMF+MTX
PTCy
In vivo T-cell depletion, n (%) No
Yes
7.6 (2-122.1)
82 (41.2) 87 (43.7) 30 (15.1)
7 (5.6) 83 (65.9) 36 (28.6) 73
91 (49.7) 92 (50.3)
108 (54.3)
91 (45.7)
119 (59.8) 80 (40.2)
155 (77.9)
44 (22.1)
30 (15.7) 9 (4.71) 39 (20.4) 113 (59.2)
106 (53.5) 81 (40.9) 11 (5.6)
94 (47.2) 105 (52.7)
0
0
0
0
199 (100)
188 (94.5)
11 (5.5)
AML: acute myeloid leukemia; BM: bone marrow; CsA: cyclosporine; D: donor; GvHD: graft-versus-host disease; Haplo: haplo-identical; KPS: Karnofsky Performance Status; MMF: mycophenolate mofetil; MTX: methotrexate; NS: not significant; PTCy: post-transplant cyclophosphamide; R: recipient; UD: unrelated donor.
haematologica | 2019; 104(3)
527
