


Page 198 - Haematologica Vol. 110 - January 2025
P. 198
LETTER TO THE EDITOR
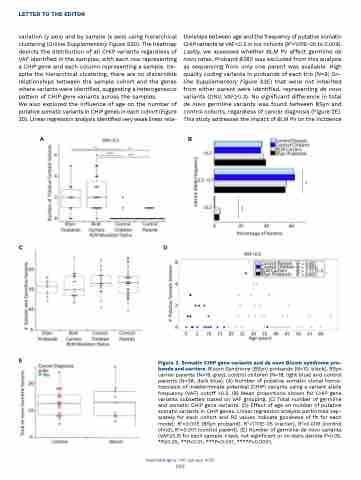
variation (y axis) and by sample (x axis) using hierarchical clustering (Online Supplementary Figure S3D). The heatmap depicts the distribution of all CHIP variants regardless of VAF identified in the samples, with each row representing a CHIP gene and each column representing a sample. De- spite the hierarchical clustering, there are no discernible relationships between the sample cohort and the genes where variants were identified, suggesting a heterogeneous pattern of CHIP gene variants across the samples.
We also explored the influence of age on the number of putative somatic variants in CHIP genes in each cohort (Figure 2D). Linear regression analysis identified very weak linear rela-
tionships between age and the frequency of putative somatic CHIP variants at VAF<0.3 in our cohorts (R2=1.111E-05 to 0.009). Lastly, we assessed whether BLM PV affect germline de novo rates. Proband B380 was excluded from this analysis as sequencing from only one parent was available. High quality coding variants in probands of each trio (N=9; On- line Supplementary Figure S3E) that were not inherited from either parent were identified, representing de novo variants (DNV, VAF≥0.3). No significant difference in total de novo germline variants was found between BSyn and control cohorts, regardless of cancer diagnosis (Figure 2E). This study addresses the impact of BLM PV on the incidence
AB
 CD
E
Figure 2. Somatic CHIP gene variants and de novo Bloom syndrome pro- bands and carriers. Bloom Syndrome (BSyn) probands (N=10, black), BSyn carrier parents (N=19, grey), control children (N=19, light blue) and control parents (N=38, dark blue). (A) Number of putative somatic clonal hema- topoiesis of indeterminate potential (CHIP) variants using a variant allele frequency (VAF) cutoff <0.3. (B) Mean proportions shown for CHIP gene variants subsetted based on VAF grouping. (C) Total number of germline and somatic CHIP gene variants. (D) Effect of age on number of putative somatic variants in CHIP genes. Linear regression analysis performed sep- arately for each cohort and R2 values indicate goodness of fit for each model: R2=0.005 (BSyn proband), R2=1.111E-05 (carrier), R2=0.009 (control child), R2=0.001 (control parent). (E) Number of germline de novo variants (VAF≥0.3) for each sample. t test, not significant or no stars denote P>0.05, *P≤0.05, **P<0.01, ***P<0.001, ****P<0.0001.
Haematologica | 110 January 2025
190


