


Page 197 - Haematologica Vol. 110 - January 2025
P. 197
LETTER TO THE EDITOR
samples as “carrier” (N=19), and control proband (N=19) and control parents (N=38) as “unaffected.” In our somatic variant analysis, we separately considered control parent and control children as age-matched controls to assess the frequency of CHIP in relation to age.
We explored multiple DP cut-offs for loci in CHIP genes (data not shown), and at DP required to identify high quality, low frequency variants, we found that BSyn probands and BLM variant carriers had statistically significantly more low frequency, putative somatic variants (0.02<, VAF<0.3) in CHIP genes with a median of 2, compared to control cohorts where no somatic CHIP gene variants were detected (medi- an =0) (Kruskal Wallis, P=1.50E-06 to 6.37E-03) (Figure 2A). We further categorized variants in CHIP genes into puta- tive somatic or germline based on VAF (Figure 2B). Con- sistently, significant differences were observed across all likely somatic variant comparisons between BSyn groups (model mean =3.70-4.80%) and control groups (model mean =0.30%) (P=1.41E-06 to 1.60E-03). No significant differences were found in the mean proportion of germline and so- matic variants between BSyn probands and BLM carriers (P=0.447), nor between control probands and control
A
B
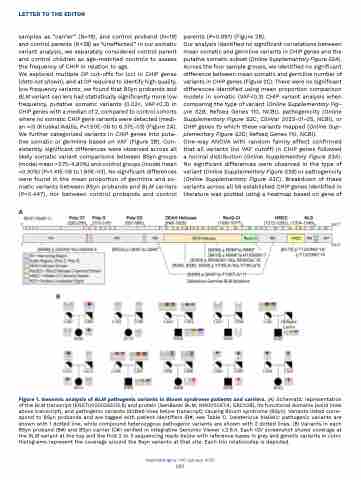
Figure 1. Genomic analysis of BLM pathogenic variants in Bloom syndrome patients and carriers. (A) Schematic representation of the BLM transcript (ENST00000355112.8) and protein (GenBank: BLM; NM000057.4; GRCh38), its functional domains (solid lines above transcript), and pathogenic variants (dotted lines below transcript) causing Bloom syndrome (BSyn). Variants listed corre- spond to BSyn probands and are tagged with patient identifiers (B#, see Table 1). Deleterious biallelic pathogenic variants are shown with 1 dotted line, while compound heterozygous pathogenic variants are shown with 2 dotted lines. (B) Variants in each BSyn proband (B#) and BSyn carrier (C#) verified in Integrative Genomic Viewer v.2.9.4. Each IGV screenshot shows coverage at the BLM variant at the top and the first 2 to 3 sequencing reads below with reference bases in grey and genetic variants in color. Histograms represent the coverage around the Bsyn variants at that site. Each trio relationship is depicted.
Haematologica | 110 January 2025
parents (P=0.991) (Figure 2B).
Our analysis identified no significant correlations between mean somatic and germline variants in CHIP genes and the putative somatic subset (Online Supplementary Figure S2A). Across the four sample groups, we identified no significant difference between mean somatic and germline number of variants in CHIP genes (Figure 2C). There were no significant differences identified using mean proportion comparison models in somatic (VAF<0.3) CHIP variant analysis when comparing the type of variant (Online Supplementary Fig- ure S2B; Refseq Genes 110, NCBI), pathogenicity (Online Supplementary Figure S2C, ClinVar 2023-01-05, NCBI), or CHIP genes to which these variants mapped (Online Sup- plementary Figure S2D; Refseq Genes 110, NCBI). One-way ANOVA with random family effect confirmed that all variants (no VAF cutoff) in CHIP genes followed a normal distribution (Online Supplementary Figure S3A). No significant differences were observed in the type of variant (Online Supplementary Figure S3B) or pathogenicity (Online Supplementary Figure S3C). Breakdown of these variants across all 56 established CHIP genes identified in literature was plotted using a heatmap based on gene of
 189


