


Page 193 - Haematologica Vol. 110 - January 2025
P. 193
LETTER TO THE EDITOR AB
CD
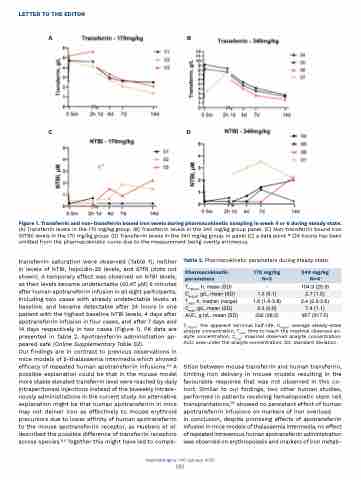
Figure 1. Transferrin and non-transferrin bound iron levels during pharmacokinetic sampling in week 4 or 6 during steady state.
(A) Transferrin levels in the 170 mg/kg group. (B) Transferrin levels in the 340 mg/kg group panel. (C) Non-transferrin bound iron (NTBI) levels in the 170 mg/kg group. (D) Transferrin levels in the 340 mg/kg group. In panel (C) a data point * (24 hours) has been omitted from the pharmacokinetic curve due to the measurement being overtly erroneous.
 transferrin saturation were observed (Table 1), neither in levels of NTBI, hepcidin-25 levels, and STfR (data not shown). A temporary effect was observed on NTBI levels, as their levels became undetectable (≤0.47 μM) 5 minutes after human apotransferrin infusion in all eight participants, including two cases with already undetectable levels at baseline, and became detectable after 24 hours in one patient with the highest baseline NTBI levels, 4 days after apotransferrin infusion in four cases, and after 7 days and 14 days respectively in two cases (Figure 1). PK data are presented in Table 2. Apotransferrin administration ap- peared safe (Online Supplementary Table S2).
Our findings are in contrast to previous observations in mice models of β-thalassemia intermedia which showed efficacy of repeated human apotransferrin infusions.5,6 A possible explanation could be that in the mouse model more stable elevated transferrin level were reached by daily intraperitoneal injections instead of the biweekly intrave- nously administrations in the current study. An alternative explanation might be that human apotransferrin in mice may not deliver iron as effectively to mouse erythroid precursors due to lower affinity of human apotransferrin to the mouse apotransferrin receptor, as Huebers et al. described the possible difference of transferrin receptors across species.8,9 Together this might have led to compe-
Table 2. Pharmacokinetic parameters during steady state.
T1/2term: the apparent terminal half-life; Cavg,ss: average steady-state analyte concentration; Tmax: time to reach the maximal observed an- alyte concentration; Cmax: maximal observed analyte concentration: AUC: area under the analyte concentration; SD: standard deviation.
tition between mouse transferrin and human transferrin, limiting iron delivery in mouse models resulting in the favourable response that was not observed in this co- hort. Similar to our findings, two other human studies, performed in patients receiving hematopoietic stem cell transplantations,7,10 showed no persistent effect of human apotransferrin infusions on markers of iron overload.
In conclusion, despite promising effects of apotransferrin infusion in mice models of thalassemia intermedia, no effect of repeated intravenous human apotransferrin administration was observed on erythropoiesis and markers of iron metab-
 Pharmacokinetic parameters
 170 mg/kg N=3
 340 mg/kg N=4
T1/2term, h, mean (SD)
 -
 104.9 (25.9)
 Cavg,ss, g/L, mean (SD)
  1.0 (0.1)
  2.7 (1.0)
  Tmax, h, median (range)
1.6 (1.6-3.8)
2.4 (2.3-2.6)
Cmax, g/L, mean (SD)
 3.3 (0.6)
 7.4 (1.1)
 AUC, g.h/L, mean (SD)
  332 (38.5)
  907 (317.0)
    Haematologica | 110 January 2025
185


