


Page 192 - Haematologica Vol. 110 - January 2025
P. 192
LETTER TO THE EDITOR
concentration (Tmax), and the area under the curve (AUC). In case of transfusions, samples were obtained pre-tranfu- sion. Adverse events (AE) and serious adverse events (SAE) were monitored. The cut-off data point for the laboratory results was after 14 weeks for NTDTI patients and prior to the last RBC transfusion on the date most closely to week 18 in TDTI patients (in order to have a longer follow-up to assess transfusion burden). This trial was approved by the institutional review board of the Amsterdam UMC, the Central Committee on Research Involving Human Subjects (CCMO) and was registered in the EudraCT database (2014- 001936-12).
Parametric data were described by mean and standard deviation (SD), non-parametric data by median and inter- quartile range (IQR) or range in case the dataset was too small to use IQR. For the pharmacokinetic (PK) analysis PhoenixTM WinNonlin® v8.1.1. was used. Non-compartmental analysis (NCA; Model Type: Plasma (200-202), Dose Type: IV Infusion) was applied. The linear trapezoidal method was used in order to calculate AUC values.
Five patients with β-thalassemia intermedia (NTDTI: HbE/ β0-thalassemia; HbE/β+-thalassemia; β0-thalassemia and
a-triplication; TDTI: dβ/ß0-thalassemia; β0/β+-thalassemia and homozygous-a3.7) received either human apotransferrin at a dose of 170 mg/kg or at a dose of 340 mg/kg (for study flow see Online Supplementary Figure S1 and baseline de- mographics Online Supplementary Table S1). Two subjects participated in both dosing groups. Blood transfusions in TDTI patients started during their life because of increasing tiredness and repeating Hb levels below 8 g/dL without any other explanation. The transfusion burden 20 weeks prior to inclusion was 0.6 units/week for the TDTI patient in the 170 mg/kg group and 0.4 and 0.75 units/week respectively for the two patients in the 340 mg/kg group.
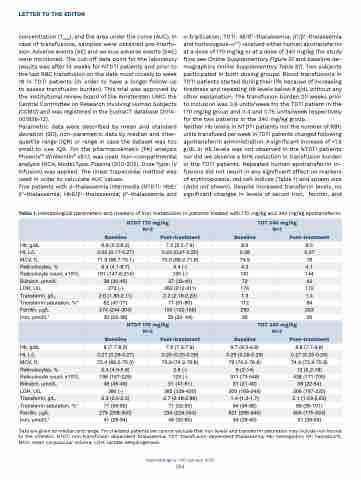
Neither Hb levels in NTDTI patients nor the number of RBC units transfused per week in TDTI patients changed following apotransferrin administration. A significant increase of >1.5 g/dL in Hb levels was not observed in the NTDTI patients nor did we observe a 50% reduction in transfusion burden in the TDTI patients. Repeated human apotransferrin in- fusions did not result in any significant effect on markers of erythropoiesis, red cell indices (Table 1) and spleen size (data not shown). Despite increased transferrin levels, no significant changes in levels of serum iron, ferritin, and
Table 1. Hematological parameters and markers of iron metabolism in patients treated with 170 mg/kg and 340 mg/kg apotransferrin.
  NTDT 170 mg/kg TDT 340 mg/kg N=2 N=1
 Baseline
 Post-treatment Baseline
 Post-treatment
Hb, g/dL
  6.8 (5.3-8.2)
  7.2 (6.5-7.9) 8.9
  8.5
  Ht, L/L
0.22 (0.17-0.27)
0.23 (0.21-0.25) 0.28
0.27
MCV, fL
 71.9 (68.7-75.1)
 70.0 (68.2-71.8) 74.9
 76
 Reticulocytes, %
  6.4 (4.1-8.7)
  4.4 (-) 4.3
  4.1
  Reticulocyte count, x109/L
181 (147.8-214)
150 (-) 161
144
Bilirubin, μmol/L
 38 (30-45)
 37 (33-40) 72
 43
 LDH, U/L
  273 (-)
  262 (212-311) 174
  172
  Transferrin, g/L,
2.0 (1.83-2.11)
2.2 (2.18-2.23) 1.3
1.4
Transferrin saturation, %*
  62 (47-77)
  71 (61-80) 112
  84
  Ferritin, μg/L
274 (244-304)
150 (102-198) 293
263
Iron, μmol/L*
  30 (25-36)
  39 (33- 44) 36
  30
  NTDT 170 mg/kg TDT 340 mg/kg N=2 N=2
 Baseline
 Post-treatment Baseline
 Post-treatment
Hb, g/dL
  8 (7.7-8.2)
  7.6 (7.3-7.9) 9.7 (9.5-9.8)
  8.8 (7.7-9.8)
  Ht, L/L
0.27 (0.26-0.27)
0.26 (0.25-0.26) 0.29 (0.28-0.29)
0.27 (0.25-0.29)
MCV, fL
 72.4 (69.5-75.3)
 73.9 (74.2-76.8) 76 (74.2-76.8)
 74.9 (73.9-75.8)
 Reticulocytes, %
  5.4 (4.9-5.8)
  3.6 (-) 8 (2-14)
  12 (5.2-18)
  Reticulocyte count, x109/L
198 (167-229)
123 (-) 311 (73-548)
438 (171-705)
Bilirubin, μmol/L
 48 (46-49)
 51 (41-61) 31 (21-40)
 38 (22-54)
 LDH, U/L
 386 (-)
 385 (339-430) 209 (169-249)
 206 (187-225)
 Transferrin, g/L,
  2.3 (2.0-2.5)
  2.7 (2.48-2.89) 1.4 (1.2-1.7)
  2.1 (1.53-2.63)
  Transferrin saturation, %*
71 (56-85)
71 (52-90) 94 (94-96)
98 (95-101)
Ferritin, μg/L
 279 (258-300)
 234 (224-243) 621 (296-945)
 550 (175-924)
  Iron, μmol/L*
  41 (29-54)
  49 (32-65) 34 (29-40)
  51 (39-63)
   Data are given as median and range. *In chelated patients we cannot exclude that iron levels and transferrin saturation may include iron bound to the chelator. NTDT: non-transfusion dependent thalassemia; TDT: transfusion-dependent thalassemia; Hb: hemoglobin; Ht: hematocrit; MCV: mean corposcular volume; LDH: lactate dehydrogenase.
Haematologica | 110 January 2025
184


