
Page 50 - Haematologica-5
P. 50
C. Lagresle-Peyrou et al.
Absence of Plerixafor-related toxicity
Prior to Plerixafor injection, patients underwent several erythrocytoapheresis sessions in order to decrease their HbS levels to below 30% (Table 1). Each patient received a single, subcutaneous injection of Plerixafor (0.24 mg/kg). The HbS values remained low until day +1 and increased to pre-treatment levels thereafter (Table 1). No adverse effects were observed, other than moderate hypokalemia related to the anticoagulant citrate infusion during the apheresis; this was corrected by a 2-day course of potassi- um chloride (Table 1). The white blood cell and neutrophil counts rose to 30.4 ± 2.8x10⁹/μL and 17.8 ± 3.5x10⁹/L, respectively, during the first 3 h, remained stable and then (within 24 to 36 h of Plerixafor injection) returned to pre- treatment values (Figure 1A and Online Supplementary Figure S1). Bilirubin, conjugated bilirubin and lactate dehy- drogenase values and monocyte counts remained stable up to day +30. Serum levels of inflammatory cytokines, including interleukin-8, which is increased in SCD patients during acute crises and associated with higher
numbers of circulating hematopoietic progenitors,22 were comparable to those of healthy controls (data not shown). Vital parameters and blood O2 saturation remained stable and normal during all the procedure. Monitoring of the patients between discharge and the end of the follow-up period (6 months after treatment) was uneventful.
Efficacy of Plerixafor in mobilizing hematopoietic stem and progenitor cells
Baseline CD34+ cell counts were 7, 10 and 10/μL in P1, P2 and P3, respectively. The patients exhibited a very fast, intense increase in peripheral blood CD34+ cell count, exceeding 80 CD34+/μL 3 h after the Plerixafor injection (Figure 1B). Levels greater than 50 CD34+/μL were main- tained for 6 h, then decreased and returned to normal pre- treatment values (Figure 1B, and data not shown for day 30 and day 60). Apheresis was performed with the technical adjustments described in the Online Supplementary Methods. The quantities of CD34+ cells harvested by apheresis (4.6 x 10⁶, 5.8x10⁶ and 4.5x10⁶/kg body weight
AB
C
782
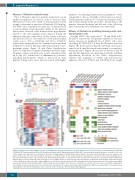
Figure 2. Analysis of the transcriptomic profiles of hematopoietic stem and progenitor cells from different sources (A) Hierarchical clustering analysis of HD BM, SCD BM, SCD Plerixafor-mobilized (Pler), HD Plerixafor-mobilized and HD Filgrastim-mobilized (Filg) HSPC (cluster method: average; distance: correlation). The color of the sample name indicates the classification. (B) Gene ontology analysis of differentially expressed genes. The most enriched biological process categories are shown on the y-axis. The x-axis shows sample comparisons, as defined in Table 3. The orange and green color gradients correspond to the statistical significance of the enrichment [expressed as –log10 (qvalue)] in up- and downregulated genes, respectively. The first color bar at the top indicates comparisons between HSPC from different types of source (dark red) or the same type of source (light red). The second color bar at the top indicates comparisons between HSPC from different types of donor (dark blue) or the same type of donor (light blue). (C) Heat map of genes involved in HSC and progenitor biology. A proportion of the HSC markers were highly expressed in SCD Plerixafor-mobilized HSPC compared with the other samples. The row Z-score is plotted on a red-blue color scale, where red indicates high expres- sion and blue indicates low expression. The color bar at the top indicates the sample classification. HD: healthy donor; BM: bone marrow; HSPC: hematopoietic stem and progenitor cells; HSC: hematopoietic stem cells; SCD: sickle cell disease; Pler: Plerixafor; Filg: Filgrastim.
haematologica | 2018; 103(5)
