
Page 33 - Haematologica-5
P. 33
TCR repertoire of effector memory T cells in AA
quencies (“midtown”). The normal CDR3 size and DJ length profiles were defined by comparing distributions among healthy donors (Figure 3B and Online Supplementary Figure S7B). In CD4+ and CD8+ cells, profiles were typically distributed in a Gaussian manner with 10- 12 different size classes of 30-65 nucleotides (nt) sizes at 3 nt intervals, and they completely overlapped. Similarly, DJ length profiles assumed an asymmetric Gaussian distribu- tion with 2-5 predominant length classes without nt inter- vals in CD4+ and CD8+ subsets.
Deep sequencing allows detailed characterization of oligoclonality in SAA
Deep sequencing of TCR repertoire was performed in CD4+ and CD8+ cells from 12 SAA patients who had demonstrated CD8+CD57+ cell expansion by flow cytom-
etry, and also in CD8+CD57+ cells from 2 of these patients. The average depth of sequencing was 13,861,048±4,992,677 in CD4+ T cells, 13,873,207±5,029,195 in CD8+ T cells, and 21,030,616±1,238,660 in CD8+CD57+ cells. The mean fre- quency of the immunodominant clone was 3.3±3.4% (range: 0.2-11.8%) in CD4+, 18.2±14.9% (range: 3.3- 54.1%) in CD8+ cells, and 59±28.9% in CD8+CD57+cells. By plotting TRBV/TRBJ rearrangements from CD4+ cells, the “citylike” landscape was found in 11 out of 12 patients (Figure 4A and Online Supplementary Figure S8A). In the CD8+ cell pool, the “citylike” landscape was found in 3 patients (AA7, AA8, and AA11), whose clones showed very low frequencies (4.3%, 3.4%, and 3.3%, respective- ly). The remaining patients displayed a “skyscraper” land- scape due to the presence of 1-3 immunodominant clones.
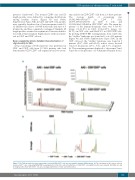
A
B
Figure 5. The TCR repertoire by deep sequencing of enriched CD8+CD57+ cells in severe aplastic anemia (SAA) patients. (A) The enrichment of the clone in effector memory CD8+ T cells, comparing TRBV/TRBJ rearrangement in total CD8+ cells (left) with those in CD8+CD57+ cells (right) from the same patients. (B) CDR3 size and DJ length profiles from CD8+CD57+ cells also overlapped with those in CD4+ and CD8+ profiles.
haematologica | 2018; 103(5)
765
