
Page 161 - Haematologica-5
P. 161
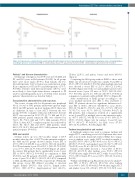
Figure 1. Progression-free survival (A) and overall survival (B) with numbers at risk of myeloma patients following up-front autologous stem cell transplantation according to presence of involvement. MM: no extramedullary disease; PS: paraskeletal involvement; EM: extramedullary organ involvement; N: number.
Autologous SCT for extramedullary myeloma
Patients’ and disease characteristics
Median age at diagnosis was 59.8 years in both MM and PS, and 59.0 years in EM patients (P=0.59). In all groups there were more males (57.9%) than females (42.1%). More EM patients (34.1%) had worse renal function (stage B) in comparison to PS (16.8%) and MM patients (17.3%; P<0.001). Patients with EM involvement (28.3%) were more likely to have light chain disease compared to PS (22.5%) and MM patients (22.1%; P=0.002). More detailed patients’ characteristics are listed in Table 1.
Transplantation characteristics and responses
The source of stem cells for all patients was peripheral blood. A total of 3391 patients underwent up-front single ASCT and 353 patients up-front tandem ASCT; there was no difference in time to first ASCT between the two groups (P=0.81). Complete remission (CR) before the first ASCT was reported in 21.5% PS, 11.7% EM and 19.1% MM patients; partial remission (PR) was achieved by 72.6% PS, 79.6% EM and 74.7% MM patients (P=0.1) (Table 1). After ASCT, complete response was achieved by 41.6% PS, 36.1% EM and 43.9% MM patients, while 54.0% PS, 51.9% EM and 49.8% MM patients showed partial response (P=0.001).
EMD and survival
Median follow up was 36.3 months (range: 1-118.9 months) after the date of ASCT. In the univariate analysis, the MM and PS groups showed similar 3-year PFS of 47.9% (95%CI: 45.8-50.1) versus 50.0% (95%CI: 44.6-55.3; P=0.78) and similar 3-year OS of 80.1% (95%CI: 78.4-81.8) versus 77.7% (95%CI: 73.3-82.1; P=0.09) (Figure 1A and B). In contrast, EM patients had a significantly worse 3-year PFS of 39.9% (95%CI: 30.3-49.5) in comparison to MM (P=0.001) and PS patients (P=0.007), and a significantly worse 3-year OS of 58.0% (95%CI: 48.1-67.9) compared to MM and PS patients (P<0.001, respectively). Within the EM group, 3-year PFS differed according to involved organs: kidney (59.5%), skin (20.1%), lymph nodes (37.6%), CNS (47.9%), lung/respiratory tract (44.4%),
GI/liver (22.5%), and spleen, ovaries and testes (60.0%) (Table 2).
Comparing the MM group without EMD to those with EMD, one involved site resulted in a similar 3-year PFS of 49.4% (95%CI: 44.6-54.3; P=0.36) while multiple involved sites showed a worse PFS of 22.7% (95%CI: 5.2-40.2; P=0.001) (Figure 2A). Both one and multiple involved sites showed worse 3-year OS rates of 73.5% (95%CI: 69.2- 77.7; P<0.001) and 71.4% (95%CI: 55.1-87.7; P=0.05) in comparison to patients without EMD (80.1%) (Figure 2B).
After stratification of EMD groups according to one versus multiple involved sites (PS1 vs. PS2, and EM1 vs. EM2), PS patients showed no significant difference in 3- year PFS of 50.5% (95%CI: 45.0-55.9%) versus 36.0% (95%CI: 5.2-66.8%; P=0.71), and OS of 77.2% (95%CI: 72.7-81.7%) versus 91.7% (95%CI: 76.0-100; P=0.27). In EM patients, this comparison resulted in a significantly worse 3-year PFS of multiple sites in the univariate analy- sis: 44.7% (95%CI: 34.1-55.3%) versus 13.9% (95%CI: 0- 35.5%; P=0.03) (Figure 3A). In contrast, 3-year OS was 58.7% (95%CI: 47.9-69.5%) for EM1 versus 57.5% (95%CI: 34.2-80.8%; P=0.51) (Figure 3B).
Tandem transplantation and survival
A landmark analysis was used to compare tandem and single ASCT, considering a total of 3139 patients who were alive at six months. In patients without EMD, the compar- ison of tandem versus single ASCT resulted in similar 3- year PFS, 53.8% (95%CI: 46.7-60.9) versus 51.3% (95%CI: 48.9-53.7; P=0.37), and similar 3-year OS: 84.7% (95%CI: 79.6-89.8) versus 81.6% (95%CI: 79.8-83.4; P=0.26).
Patients with EMD showed a 3-year PFS of 59.0% (95%CI: 46.3-71.8) after tandem versus 53.0% (95%CI: 47.5-58.6) after single (P=0.43) ASCT, while 3-year OS was 77.0% (95%CI: 66.1-87.9) versus 76.9% (95%CI: 72.4-81.4; P=0.91).
Within each EMD group, PS patients showed a similar 3- year PFS of 59.4% (95%CI: 45.3-73.6) after tandem versus 54.3% (95%CI: 48.0-60.5; P=0.44) after single ASCT and similar 3-year OS of 82.6% (95%CI: 72.3-92.8) versus
haematologica | 2018; 103(5)
893
