
Page 150 - Haematologica-5
P. 150
I. Misiewicz-Krzeminska et al.
DNA/RNA extraction and quantitative real-time polymerase chain reaction analysis
mRNA expression was evaluated by Taqman assay quantitative real-time polymerase chain reaction (qRT-PCR) analysis using the respective GAPDH Taqman assay as a control, by the 2-ΔCt method.
Statistical analysis
Spearman correlations were calculated. Progression-free sur- vival (PFS) was calculated for each gene and protein. Survival curves were plotted using the Kaplan–Meier method and statisti- cal significance was evaluated with the log-rank test.
Results
Protein extraction from RLT Plus buffer results in optimal quality and quantity
Firstly, we evaluated the amount and quality of the pro- tein extracted with our protocol. The data generated by the WESTM system were visualized as virtual blots (Figure 2A) or peaks (Figure 2B) that were quantified as the area under the curve using the inbuilt algorithm of the CompassTM software. Using JJN3 myeloma cell line lysates of known concentration, we generated a protein standard curve that proved to be linear over the evaluated range of concentrations (Figure 2C). The amount of protein obtained from each sample ranged between 0.00 and 0.36 mg protein, with a median quantity of 0.06 mg per sam- ple. Three of the 63 samples had insufficient material to analyze protein expression (Figure 2D). We compared the expression of the various proteins extracted from MM cells stored in RLT Plus buffer with that obtained using the standard RIPA protocol and found the signals to be similar for the two protocols (Figure 2E,F).
Optimization of protein quantification by capillary nano-electrophoresis with immunoassay
For each analyzed protein, we first searched in the ProteinSimple antibody database for the optimized condi- tions (http://www.proteinsimple.com/antibody/antibod- ies.html). If the antibody was present, we re-evaluated it in our system, using the antibody at the indicated concentra-
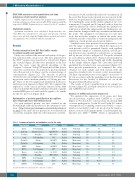
tion and at double and half the indicated concentration. In the event that the protein evaluated was not present in the database, we performed a full optimization, which consist- ed of running the assays in the cell line samples at two con- centrations (0.1 mg/mL and 0.2 mg/mL) with at least five antibody dilutions in order to determine the optimal con- centration at which the antigen-antibody binding was sat- urated and no change in antibody concentration influenced the result. The optimized concentrations for each anti- body, the molecular weights at which the peaks were observed, and the coefficients of variation arising from the validation of each protein are shown in Table 1.
Standard curves were produced for each protein to eval- uate the range of linearity over which the expression of each protein could be quantified. Briefly, each capillary contained the sample at a different dilution, and the pro- tein detection was visualized as virtual blots, as exempli- fied by the use of Aiolos in Figure 3A. The peaks obtained for each dilution, which were obtained automatically by the program, have a distinct height and width, depending on the sample dilution (Figure 3B). Once they had been quantified the standard curve was generated (Figure 3C). After protein quantification, we compared the value obtained for each sample and each protein with the respective standard curve to ensure correct measurement. The limit of quantitation was set as signal-to-noise ratio of 10:1 in accordance with the guidelines from the European Directorate for the Quality of Medicine set out in the European Union Pharmacopoeia.8
The results of Aiolos quantification in six samples are shown in Figure 3D, in which virtual blots for both Aiolos and GAPDH are presented.
Analysis of mRNA and protein expression
We analyzed the expression of 12 genes and their encoded proteins, together with GAPDH as a control (Figure 1). We decided to select proteins involved in MM or cancer pathogenesis: Cyclin D1 and Cyclin D2, whose overexpression is a unifying event for most MM;9–11 c-myc, which is consistently found to be involved in the transfor- mation of monoclonal gammopathy of undetermined sig- nificance into MM;12,13 HSP90, which is upregulated in
Table 1. Summary of proteins and antibodies used in the study.
1
2 3 4 5 6 7 8 9 10 11 12 13
Target protein
Aiolos
Calnexin Cereblon c-myc Cyclin D1 Cyclin D2 DDX21 HSP90 Ikaros PSME1 RIPK1 XAF1 GAPDH
Company
Cell Signaling
Enzolifesciences NovusBio Cell Signalling Abcam
Cell Signaling Abcam
Cell Signaling Santa Cruz NovusBio Cell Signaling Cell Signaling Cell Signaling
Cat number
12720
ADI-SPA-860 NBP1-91810 5605 Ab134175 3741 Ab182156 4877 Sc-13039 NBP1-83121 3493 13805 2118
Species
Rabbit
Rabbit Rabbit Rabbit Rabbit Rabbit Rabbit Rabbit Rabbit Rabbit Rabbit Rabbit Rabbit
Clonality
Polyclonal
Polyclonal
Polyclonal Monoclonal Monoclonal Monoclonal Monoclonal Monoclonal Polyclonal Polyclonal Monoclonal Monoclonal Monoclonal
Dilution Ab
1:100
1:250 1:80 1:50 1:50 1:100 1:100 1:50 1:50 1:50 1:50 1:25 1:50
MW peak
85
119 59 75 40 38 110 95 70 37 79 46, 110 42
Intra-assay CV (%)
10.9
4.9 9.7 8.3 9.9 7.8 11.4 7.0 10.8 10.2 5.8 15.5 8.6
882
Ab: antibody; MW: molecular weight; CV: coefficient of variation.
haematologica | 2018; 103(5)
