
Page 119 - Haematologica-5
P. 119
Omnibus (http://www.ncbi.nlm.nih.gov/geo/) under accession num- ber GSE89447. Cases used for these procedures are reported in Online Supplementary Table S2.
Validation procedures
The 6-gene signature was tested in the MCL cohort described by Saba et al.,30 enrolled in another clinical trial (clinicaltrials.gov identifier: 00114738), by using the sum of the array gene expression values, as reported.30 Gene signatures related to MCL outcome were retrieved from previous papers,30,38 and imported in the GeneSpring GX and tested in the present cohort with GEP data available.
Statistical analysis
Overall survival was computed from trial registration to death as a result of any cause, censored at the latest follow up in patients who were still alive. Progression-free survival (PFS) was computed from trial registration to progression or death as a result of any cause, censored at the latest tumor assessment if no progression was observed. Clinical correlations, performed with the MedCalc v.9.5 software, were made using Kaplan-Meier plots and log-rank test. The Cox proportional model was chosen for multivariable analysis. Clinical outcome results were up-dated as of January
2017.32 Investigators are still blinded to the investigation arm as the primary study end point has still not been met.
Results
GEP identifies MCL patients with distinct expression of genes belonging to the BCR pathway
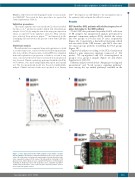
Global GEP was performed in purified MCL cells from 27 PB samples. An unsupervised analysis performed by principal component analysis (PCA) divided the cohort into two groups of 14 cases and 13 cases, respectively (Figure 1A). Consistently, a hierarchical clustering, which was run with all the GEP features, split MCL cases into two major groups perfectly resembling the PCA groups (Figure 1B).
Supervised analysis according to the PCA classification defined a gene expression signature composed of 922 probes, 713 up-regulated and 209 down-regulated in group-2 versus group-1 samples (Figure 1C and Online Supplementary Table S3).
Pathway analysis revealed that “Antigen processing and presentation” and “B-cell receptor signaling pathway” were among the top ranked pathways enriched in the
B-cell receptor signature in mantle cell lymphoma
AB
Figure 1. Gene Expression Profile (GEP) analysis of 27 mantle cell lym- phoma samples. (A) Principal Component Analysis (PCA) scores represent- ed in a 3D scatter plot. One point per array/sample is shown. Black line indi- cates separation between PCA classes. (B) Hierarchical clustering of 14 group-1 cases and 13 group-2 cases, using 50,739 probes. (C) Hierarchical clustering of 14 group1 cases and 13 group2 cases, using the 922 differ- entially expressed probes. Color codes for gene expression values refer to mean centered log-ratio values.
C
haematologica | 2018; 103(5)
851
