
Page 158 - Haematologica-April 2018
P. 158
A.-S. Michallet et al.
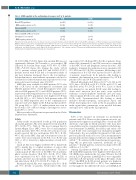
Table 3. MRD negativity at the confirmation-of-response visita in 1L patients.
Overall ITT population MRD-negative patients, n (%)
Patients with CR
MRD-negative patients, n (%) Patients with CR or PR based on the investigator’s assessmentb
MRD-negative patients, n (%)
R-B
(n=121) 49 (41) (n=29) 19 (66)
(n=89)
47 (53)
R-Clb
(n=120) 16 (13) (n=11) 4 (36)
(n=90)
16 (18)
702
aPerformed 12 weeks after the end of C6 disease response assessment. bIncludes patients with CR (with or without BM confirmation) or PR by investigator assessment. Negative MRD was defined as proportion of malignant B cells to white blood cells of <10-4,as assessed by allele-specific oligonucleotide real-time quantitative polymerase chain reaction assay measured in BM aspirate (or PB if BM unavailable). MRD data were available for 45/50 patients with a CR based on the investigator’s assessment (BM, n=42; PB, n=1; unknown=2) and 182/241 patients overall (BM, n=145; PB, n=32; unknown=5). CR: complete response; ITT: intent-to-treat; MRD: minimal residual disease; PR: partial response; RB: rituximab plus bendamustine; R-Clb: rituximab plus chlorambucil.
CI 0.339-0.806; P=0.003; Figure 2A); median OS was not significantly different (43.8 months vs. not reached; HR [adjusted for baseline Binet stage] 0.975, 95% CI 0.505- 1.880; P=0.939; Figure 2B). During the study, 11/121 (9.1%) patients treated with R-B and 22/120 (18.3%) patients treated with R-Clb had a documented intake of any new leukemia treatment. Due to the low numbers, the median time to next leukemic treatment could not be calculated for either treatment arm (log-rank test for com- parison between treatment arms: P=0.037).
MRD data were available for 45/50 patients (90%) who had a CR based on the investigator’s assessment and 182/241 patients (76%) overall. BM aspirates were avail- able for 42/45 patients (93%) and 145/182 patients (80%), respectively. MRD-negativity rates at the confirmation-of- response visit (ITT population) were higher for R-B than for R-Clb (41% vs. 13%; Table 3). In 1L patients with a CR after C6, MRD-negativity rates at the confirmation-of- response visit were higher in the R-B group than in the R- Clb group (66% vs. 36%). A similar pattern was seen in those with a CR or PR according to investigator’s assess- ment (53% vs. 18%).
Efficacy results in 2L patients are presented in the Online Supplementary Information.
Safety
reported for 92% (R-B) and 80% (R-Clb) of patients. Drug- related AEs (rituximab, B, and Clb) were most commonly of the SOC ‘blood and lymphatic system disorders’. AEs leading to rituximab discontinuation were experienced by 18% (R-B) and 11% (R-Clb) of patients. AEs leading to dis- continuation of B or Clb were reported for 19% and 18% of patients, respectively. In 1L patients, AEs leading to treatment discontinuation were experienced by 22 R-B patients (18%) and 14 R-Clb patients (12%).
Overall, 65 patients died (R-B, n=30, 17%; R-Clb, n=35, 20%) due to CLL (R-B, n=14, 8%; R-Clb, n=20, 11%) and AEs (R-B, n=16, 9%; R-Clb, n=14, 8%). Cause of death was missing for one patient (R-Clb arm). AEs leading to death were infection (n=4 per arm), acute myeloid leukemia or myelodysplastic syndrome (n=1 per arm), other neoplasm (R-Clb, n=1), and other causes (R-B, n=11; R-Clb, n=8). Treatment-related AEs leading to death included thrombocytopenia, neutropenic sepsis and febrile neutropenia (n=1 each) in the 1L population and multi-organ failure, pneumonia, acute myeloid leukemia and sepsis (n=1 each) in the 2L population.
Discussion
R-FC is the standard 1L treatment for medically-fit patients with CLL. However, this regimen can cause sig- nificant myelosuppression and high rates of early and late infections, especially in elderly patients15 who may have comorbidities and be considered ineligible for fludarabine- based treatment.6 In MABLE, the efficacy and safety of R- B and R-Clb were investigated in fludarabine-ineligible CLL patients. B is an established treatment for CLL, and a previous phase III study of B versus Clb in treatment-naïve patients demonstrated improved CR rates and median PFS with B.12,13 R combined with chemotherapeutic agents pro- longs OS in previously untreated, medically fit CLL patients.16,17 In unfit patients, survival was improved by the addition of G to Clb.10
Among 1L patients in MABLE, the rates of CR and of CR with MRD-negativity were higher for R-B than for R- Clb. ORRs were similar in the two arms. Whereas the CR rate in 1L R-Clb patients in MABLE (9%) was comparable with that in R-Clb patients in the phase III CLL11 study (7%),10 the ORR for R-Clb-treated patients was higher in MABLE than in CLL11 (86% vs. 58%). Two explanations for this might be the different Clb doses used (MABLE, 10
Safety results are presented for the pooled population (1L and 2L patients). AEs were similar between arms (R-B, 98%; R-Clb, 97%; Table 4). The most common AEs by System Organ Class (SOC) were ‘blood and lymphatic system disorders’ (R-B, 75%; R-Clb, 64%); the most com- monly reported AE was neutropenia (R-B, 56%; R-Clb, 49%). AEs in the SOC ‘skin and subcutaneous tissue dis- orders’ were more frequent in the R-B versus R-Clb arm (36% vs. 23%), driven by a higher incidence of rash (16% vs. 5%).
Grade ≥3 AEs were higher with R-B (75%) than R-Clb (64%), mainly due to a higher incidence of serious AEs (SAEs) of the SOC ‘infections and infestations’. The most common grade ≥3 AEs were of the SOC ‘blood and lym- phatic system disorders’ (R-B, 56%; R-Clb, 47%). SAEs were experienced by 41% (R-B) and 32% (R-Clb) of patients, and were most frequently of the SOC ‘infections and infestations’ (R-B, 19%; R-Clb, 8%; Table 4).
Rituximab-related AEs were experienced by 81% (R-B) and 73% (R-Clb) of patients. B/Clb-related AEs were
haematologica | 2018; 103(4)
