
Page 193 - Haematologica3
P. 193
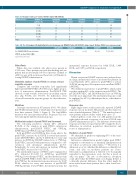
DDAVP response in moderate hemophilia A
Table 2A. Response rates per *Lowest lifetime factor VIII (FVIII:C).
FVIII:C (IU/dL)*
1
2
3
4
5 Total
Number of Inadequate Partial Complete Excellent % At least patients (%) Response Response Response Response comlete
7(4) 6 0 0 1 14
16 (9) 12 43 (25) 16 47(28) 15 56 (33) 21
169 70
2 2 0 13 7 14 6 47 10 12 10 47 12 15 8 41
31 43 25
Table 2B. Pre-1-Deamino-8-D-ArgininVasoPressin (desmopressin; DDAVP) factor VIII (FVIII:C) minus lowest lifetime FVIII:C, per response group.
All patients
Pre-DDAVP FVIII:C-lowest lifetime 0 (0-4) FVIII:C, median IU/dL (IQR)
IQR: interquartile range.
Side effects
Where data was available, side effects were present in 3/119 cases. Three patients reported skin flushing and one patient had an abnormally low blood pressure (defined as <2SD for age) with an increased heart rate (>100/min) fol- lowing DDAVP administration.
Univariate analyses of peak FVIII:C: no versus at least complete response
Complete and excellent responders had significantly higher pre-DDAVP FVIII:C (P<0.001) and a higher propor- tion of intravenous administration. Pre-DDAVP VWF showed a trend towards lower levels in excellent respon- ders (Ag: P=0.06, Act: P=0.07). No differences were observed between the response groups for other character- istics.
Mutations
Genotype was known in 107 patients (63%). We identi- fied 58 different mutations of which nine were present in at least three patients (Table 3, Figure 2). The Arg2169His mutation was most prevalent (n=21). Responses are scat- tered among the different mutation groups.
Multivariate analysis of peak FVIII:C and increment
Inadequate Partial Complete Excellent
0 (0-0) 0 (0-1) 4 (0-8) 7 (3.5-13.5)
incremental response decreases by 0.026 IU/dL, 1.469 IU/dL, and 0.187 year*IU/dL, respectively.
Discussion
Herein, we present DDAVP response rates and predictors in a large, international cohort of moderate HA patients. In total, 68 patients (40%) achieved a peak FVIII:C of at least 30 IU/dL, among these 25 responses were excellent (FVIII:C ≥ 50IU/dL).
We identified six predictors of peak FVIII:C, which, taken together, explain 65% of the variation in peak FVIII:C. The pre-DDAVP FVIII:C and DDAVP-induced rise in VWF:Ag were the most important. The incremental response could be explained for 29% by different predictors, other than for peak FVIII:C.
Response rates
Eight single-center studies previously reported DDAVP response rates in moderate HA patients and the character- istics of included patients (Table 5).15-22 The number of mod- erate patients in these studies varied from one to 17.
Taken together, a total of 12 out of 56 patients from the eight studies showed a response of at least 30 IU/dL after DDAVP administration (21%). The difference between the response rates that we report herein (40%) might be due to differences in selection, population characteristics and routes of administration.
Predictors of peak FVIII:C
We identified six predictors explaining 65% of the varia- tion in peak FVIII:C.
Intravenous administration predicts higher peak FVIII:C compared to subcutaneous or intranasal administration in our cohort, as well as in other studies.17,24-31 However, it is unknown, as of yet, whether this difference is clinically rel- evant, and data on moderate patients are scarce. Subcutaneous administration is believed to be biologically equivalent to the intravenous route, but this is based on only one paper.32 The rate of subcutaneous absorption could affect either the FVIII:C peak or its timing. If there is a clinically relevant difference, then this effect might be more critical in moderate patients due to their lower base- line levels.
The following predictors explain 65% (Adjusted R2=0.65) of the variation in peak FVIII:C: intravenous administration, pre-DDAVP FVIII:C and VWF:Ag, DVWF:Ag, peak VWF:Act and age (Table 4A).
Both pre-FVIII:C and DVWF:Ag have strong effects; the peak FVIII:C increases by 2.5 IU/dL for every unit increase in pre-DDAVP FVIII:C, and by 0.165 IU/dL for every unit increase in DVWF:Ag (DDAVP induced rise of VWF:Ag). Peak FVIII:C increased with intravenous compared to sub- cutaneous and intranasal administration (β=3.7). Remarkably, for every unit increase in baseline VWF:Ag, peak FVIII:C decreases by 0.117 IU/dL.
The incremental response of FVIII:C can be explained for 29% (Adjusted R2=0.29) by DVWF:Ag, pre-DDAVP VWF:Ag, lowest lifetime FVIII:C, and the interaction term age*pre-DDAVP FVIII:C (Table 4B). For every unit increase in D VWF:Ag, the incremental response increases by 0.047 IU/dL, whereas for every unit increase of pre-DDAVP VWF:Ag, lifetime lowest FVIII:C, the interaction term, the
haematologica | 2018; 103(3)
553
