
Page 192 - Haematologica3
P. 192
J.I. Loomans et al.
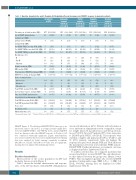
Table 1. Baseline characteristics and 1-Deamino-8-D-ArgininVasoPressin (desmopressin; DDAVP) response in moderate patients.
All patients n=169
Inadequate response <20 IU/dL n=70 (41%)
1975 (1960-1992) 21 (8-43)
4 (2-5)
4 (3-5) 95 (82-113) 103 (81-127)
Partial response 20-29 IU/dL n=31 (18%)
Complete
response 30-49 IU/dL n=43 (25%)
Excellent
response ≥50 IU/dL n=25 (15%)
Calendar year of birth, median (IQR) Age at DDAVP administration, median years (IQR)
Lifetime lowest FVIII:C,
median IU/dL (IQR)
Pre-DDAVP FVIII:C, median IU/dL (IQR) Pre-DDAVP VWF:Act, median IU/dL (IQR) Pre-DDAVP VWF:Ag, median IU/dL (IQR) Bloodgroup, n (%)
O
Non-O Unknown
Weight, median kg (IQR)
BMI, median (IQR)
Total amount of DDAVP, median μg (IQR) DDAVP dose per kg, median μg (IQR) Route of administration
Intraveneous Intranasal Subcutaneous
Peak FVIII:C, median IU/dL (IQR) Incremental response, median (IQR) Time after DDAVP administration
for peak levels, median minutes (IQR) Peak VWF:Act median IU/dL (IQR) Peak VWF:Ag median IU/dL (IQR) Test, n (%)
Treatment,n(%)
1977 23
4
5 87 93
33 33 103 75 24 20 0.3
104 9 56 24 4 60
203 209 159
(1961-1991) (12-41)
(3-5)
(4-9) (63-110) (75-118)
(20) (20) (61) (54-86) (19-27) (16-24) (0.29-0.31)
(62) (5) (33) (14-39) (2.7-6.3) (60-75)
1971 25
4
5 84 93
(1961-1990) (17-35)
(3-5)
(4-6) (62-112) (78-116)
1979 23
4
7 73 96
(1959-1991) (9-49)
(3-5)
(5-12) (44-132) (69-120)
(33) (12) (56) (45-85) (17-26) (14-24) (0.25-0.31)
1974 28
4
11 73 76
3 5 17 77 25 20 0.3
20 2 3 63 5,5 60
212 248 25
(1964-1990) (16-41)
(3-5)
(8-17) (60-98) (59-100)
(12) (20) (68) (62-96) (18-27) (19-29) (0.29-0.30)
(80) (8) (12) (57-87) (4.4-8.7) (30-60)
(178-284) (184-371) (100)
9 (13) 7 (23)
14 5 24 76 25 20
9 (29) 15 (48) 72 (60-88) 26 (19-29) 20 (18-24)
14 (20)
47 (67)
72 (48-83)
22 (19-27)
20 (14-24)
0.3 (0.30-0.32) 0.3 (0.30-0.31) 0.3
552
(186-260) (188-257) (94)
33 (47) 3 (4) 34 (49)
13 (8-17) 3 (2.1-4) 60 (60-82)
200 (192-234) 212 (188-267)
19 (61) 3 (10) 9 (29)
24 (21-27) 4.8 (3.9-6.5) 60 (52-78)
210 (137-260) 206 (184-215)
32 (74) 1 (2) 10 (23)
36 (33-42) 5.1 (3.4-8) 60 (45-75)
205 (118-326) 197 (153-216)
65 (93)
9 (5) 4 (6) 3 (10) 2 (5) 0
Mutation known, n (%) 106 (63) 40 (57) 17 (55) 31 (72) 18 (72)
*Interquartile Range (IQR).**Number.FVIII:factorVIII;VWF:Act:vonWillebrand factor activity;VWF:Ag:vonWillebrand factor antigen;BMI:body mass index.
28 (90)
41 (95)
DDAVP (Figure 1). We added pre-DDAVP FVIII:C times age as an interaction term to the model, as younger patients might have lower pre-DDAVP FVIII:C and VWF:Ag levels, and pre-DDAVP levels are known to affect the DDAVP response. A P-value <0.05 was considered statistically significant. Logistic transformation was used for variables that were not-normally distributed. Missing data were analyzed by Little’s missing completely at random (MCAR) test. If Little’s MCAR test P-value was not significant, missing data was imputed by multiple imputation.
Results
Baseline characteristics
Eleven percent of the source population (n=169) had moderate disease severity (Figure 1).
Table 1 shows the baseline characteristics and response rates of the 169 moderates with DDAVP. Administration
was mostly intravenous (62%). Patients with subcutaneous versus intravenous administration were comparable, except for weight (mean 76 kg intravenous and 52 kg subcuta- neous, P<0.001). In total, 99 patients (59%) were responsive to DDAVP (peak FVIII:C >20 IU/dL). The responses were excellent, complete and partial in 25 (15%), 43 (25%), and 31 (18%) patients, respectively. Table 2A displays the response rates per lowest lifetime FVIII and Table 2B shows the discrepencies between lowest lifetime FVIIII and pre- DDAVP FVIII. Further information on treatment outcomes is displayed in Online Supplemental Table S1.
To address selection bias, we compared moderates that received and did not receive DDAVP. The only characteris- tic that differed between the groups was lifetime lowest FVIII:C. This was higher in patients who received DDAVP (median 4 (interquartile range [IQR] 3-5) vs. 3 (IQR 3-4) IU/dL, P=0.002). Missing data are displayed in Online Supplementary Table S2.
haematologica | 2018; 103(3)
