
Page 132 - 2020_07-Haematologica-web
P. 132
I. Truxova et al.
recovered normal, non-malignant hematopoiesis exhibit a remarkable upregulation of genes linked to TH1 polar- ization, T-cell activation and cytotoxic immune respons- es.10 To confirm and extend these findings, we assessed the expression levels of 46 genes linked to immune func- tion, with particular focus on NK-cell activity, in the PBMCs of 37 AML patients in remission (Online Supplementary Table S3). We identified five genes that were differentially expressed in CRTHi versus CRTLo patients, namely, IFNA1, IFNB1, CD3E, CD8A and CD28 (Figure 3E and Online Supplementary Figure S4A). Importantly, type I IFN including the products of IFNA1 and IFNB1 are also involved in the capacity of DCs to enhance NK-cell effector functions (23).
Taken together, our results suggest that CRT exposure on the surface of malignant blasts stimulates NK-cell effector functions indirectly, by altering the migratory capacity, surface phenotype, and secretory profile of CD11c+CD14high APCs.
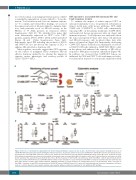
CRT exposure is associated with increased NK- and T-cell responses in mice
To examine the impact of surface-exposed CRT on anticancer immunity in vivo, we generated subcutaneous tumors in B6 mice with mouse wild-type (WT) AML C1498 cells (C1498.WT) or C1498 cells constitutively exposing CRT on the plasma membrane (C1498.CRT), and monitored disease progression (data not shown) and immune responses. T-cell response was analyzed both in the tumor and spleen (19 days after tumor cell injection) and NK-cell response only in spleen (three days after tumor cell injection) (Figure 4A). Importantly, developing C1498.CRT tumors resulted in an enrichment of activat- ed CD107a+ NK cells (defined as CD45+CD3–NK1.1+ cells) in the spleen, and enhanced the capacity of NK cells to respond to PMA plus ionomycin stimulation (Figure 4B). In addition, we observed that C1498.CRT tumors are infiltrated by CD4+and CD8+ T cells with improved effec- tor functions in response to non-specific stimulation with
A
B P=0.010 P=0.033
C
P=0.049 P=0.008 P=0.006 P=0.049
P=0.001
D
P=0.022
Figure 4. The role of calreticulin in natural killer-cell- and T-cell-based immune response in vivo in mice. (A) Schematic representation showing the process of C1498.WT/CRT tumor generation and monitoring the immune responses. To generate tumors in vivo, 1x10⁶ C1498.WT or C1498.CRT cells were inoculated sub cuta- neoulsy into the lower right flank of B6 mice on day 0 (D0). Tumor size was measured every two days by standard laboratory caliper. Mice were sacrificed on D3 or D19 and spleen and tumors were harvested for analysis of functional status of natural killer (NK) cells (spleen on D3) and T cells (both spleen and tumors on D19) by flow cytometry. The experiment was performed three times. (B) The frequency of CD107a+ NK cells (defined as CD45+CD3–NK1.1+ cells) in spleen harvested from mice injected with C1498.CRT versus C1498.WT without further in vitro stimulation or upon stimulation with PMA + Ionomycin determined by flow cytometry. Box plots: lower quartile, median, upper quartile; whiskers, minimum, maximum. (C, D) The frequency of activated IFN-g+CD4+ T cells and CD107a+ CD8+ T cells upon in vitro PMA + Ionomycin or anti-CD3 bead stimulation in C1498.CRT versus C1498.WT tumors (C) or spleen (D) determined by flow cytometry. Unstimulated cells were used as a controls. Box plots: lower quartile, median, upper quartile; whiskers, minimum, maximum; ns: not significant. WT: wild-type.
1874
haematologica | 2020; 105(7)
