
Page 75 - Haematologica - Vol. 105 n. 6 - June 2020
P. 75
Innate drug responses in hematologic cell populations
A
B
C
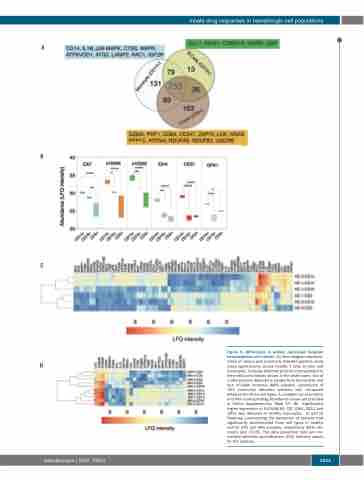
D mass spectrometry across healthy T cells, B cells and monocytes. Uniquely detected proteins corresponded to their cellular functions shown in the inset boxes. Out of 1,060 proteins detected in lysates from two healthy and four multiple myeloma (MM) samples, abundance of 753 commonly detected proteins was compared between the three cell types. A complete list of proteins and their corresponding abundance values are provided in Online Supplementary Table S7. (B) Significantly higher expression of S100A8/A9, CAT, IDH1, CES1 and GPX1 was detected in healthy monocytes. (C and D) Heatmap summarizing the expression of proteins that significantly discriminated three cell types in healthy control (HC) and MM samples, respectively (false dis- covery rate <0.05). The data presented here are nor- malized label-free quantification (LFQ) intensity values
Figure 5. Differences in protein expression between hematopoietic cell subsets. (A) Venn diagram represen- tation of unique and commonly detected proteins using
for the proteins.
haematologica | 2020; 105(6)
1533
