
Page 72 - Haematologica - Vol. 105 n. 6 - June 2020
P. 72
M.M. Majumder et al.
compared to other cell types. Except for NK-T cells from one donor, all T-cell subsets formed a distinct cluster.
Based on observations from the primary screen, we focused our in-depth analysis on six compounds display- ing either non-selective (proteasome inhibitor bortezomib
A
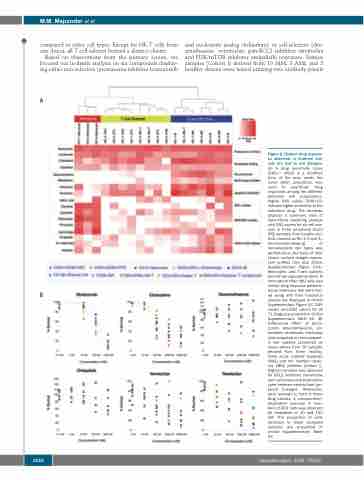
and nucleoside analog clofarabine) or cell-selective (dex- amethasone, venetoclax, pan-BCL2 inhibitor navitoclax and PI3K/mTOR inhibitor omipalisib) responses. Sixteen samples (Cohort I) derived from 10 MM, 3 AML and 3 healthy donors were tested utilizing two antibody panels
B
Figure 2. Distinct drug respons- es observed in immune sub- sets are tied to cell lineages. (A) A drug sensitivity score (DSS),16 which is a modified form of the area under the curve (AUC) calculation, was used to quantitate drug responses among the different detected cell populations. Higher DSS values (DSS>10) indicate higher sensitivity to the individual drug. The heatmap displays a summary view of hierarchical clustering analysis with DSS scores for six cell sub- sets in three peripheral blood (PB) samples from healthy con- trols (marked as HC-1, 2 and 3). Immunophenotyping of hematopoietic cell types was performed on the basis of their known surface antigen expres- sion profiles (see also Online Supplementary Figure S1A). Monocytes and T-cell subsets formed two separate clusters. B and natural killer (NK) cells had similar drug response patterns. Small molecules that were test- ed along with their functional classes are displayed in Online Supplementary Figure S3. DSS scores and IC50 values for all 71 drugs are provided in Online Supplementary Table S2. (B) Differential effect of borte- zomib, dexamethasone, clo- farabine, venetoclax, navitoclax and omipalisib on hematopoiet- ic cell subsets presented as mean values from 16 samples derived from three healthy, three acute myeloid leukemia (AML) and ten multiple myelo- ma (MM) patients (Cohort I). Highest variation was observed for BCL2 inhibitors (venetoclax and navitoclax) and dexametha- sone between myeloid and lym- phoid lineages. Monocytes were resistant to both of these drug classes. A concentration- dependent increase in num- bers of CD3+ cells was observed for omipalisib at 10 and 100 nM. The proportion of cells detected in these analyzed samples are presented in Online Supplementary Table S3.
1530
haematologica | 2020; 105(6)
