
Page 66 - Haematologica - Vol. 105 n. 6 - June 2020
P. 66
L.A. Richards et al.
which drives telomerase activity levels in erythroid cells. These results are notable in relation to past studies that established the paradigm of TERT transcriptional regula- tion as the primary determinant of telomerase regulation in hematopoietic and cancer cells.19,20,33-35
Past investigations of telomerase regulation in hematopoietic cells focused on lymphoid cells, myeloid progenitors and myeloid leukemia cell lines.11-13,36 These studies revealed that mitogen-induced upregulation of telomerase was followed by telomerase downregulation during differentiation. Studies of lymphoid and myeloid cells also established a direct role for MYC in the tran- scriptional regulation of TERT and telomerase re-activa- tion in hematopoietic cells.19,37 Consistent with this para- digm, the present study found parallel upregulation of TERT and telomerase activity in the presence of MYC pro- tein in CB progenitor cells stimulated with STF. However,
AB
there was a clear dissociation of this pathway when cul- tures were switched to erythroid conditions. Upon switching cultures from STF to SE, the abundance of MYC protein was sustained, but TERT expression declined to an apparently rate-limiting level while telomerase enzyme activity escalated. Rather than correlating with TERT expression, the increase in telomerase activity detected in erythroblastic cells correlated with upregulation of endogenous DKC1 mRNA. Modulation of DKC1 expres- sion by overexpression or targeting with shRNA con- firmed that DKC1 regulated telomerase activity in ery- throid cells without altering TERT gene expression. The functional significance of these observations was further supported by evidence of telomere lengthening following upregulation of DKC1 in the HEL 92.1.7 erythroid cell line. DKC1 mRNA was shown to be abundant in CB- derived CD34-/GLYA+ erythroid cells irrespective of
C
D
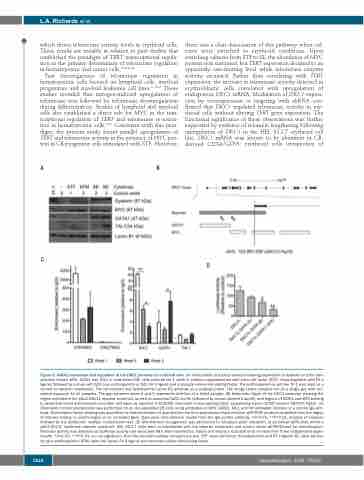
Figure 5. GATA1 interaction and regulation of the DKC1 promoter in erythroid cells. (A) Immunoblot of nuclear extracts showing expression of dyskerin and the tran- scription factors MYC, GATA1 and TAL1 in cord blood (CB) cells cultured for 1 week in medium supplemented with stem cell factor (SCF), thrombopoietin and Flt-3 ligand, followed by culture with SCF plus erythropoietin or SCF, Flt-3 ligand and monocyte colony-stimulating factor. The erythroleukemia cell line TF-1 was used as a control for dyskerin expression. The immunoblot was hybridized to Lamin B1 antibody as a loading control. The image shows samples run on a single gel, with con- sistent exposure for all samples. The gap between lanes 4 and 5 represents deletion of a failed sample. (B) Schematic figure of the DKC1 promoter showing the region included in the pGL2-DKC1L reporter construct, as well as canonical GATA motifs (indicated by arrows labeled A and B), and regions of GATA1 and MYC binding in peripheral blood erythroblasts and other cell types as reported in ENCODE chromatin immunoprecipitation sequencing traces (UCSC browser GRCh37/hg19). (C) Chromatin immunoprecipitation was performed on ex vivo-expanded CB cells using antibodies to MYC, GATA1, TAL1 and trimethylated histones or a control IgG anti- body. Transcription factor binding was quantified as fold-enrichment of quantitative real-time polymerase chain reaction (qRT-PCR) products amplified from the region of interest relative to control region in an unrelated gene. Data were normalized to results from the IgG control antibody. *P<0.05, **P<0.01, analysis of variance followed by the Bonferroni multiple comparisons test. (D) Site-directed mutagenesis was performed to introduce point mutations at canonical GATA sites within a pGL2-DKC1L luciferase reporter construct. HEL 92.1.7 cells were co-transfected with the reporter constructs and control vector pEFBOS-LacZ for normalization. Promoter activity was detected as luciferase activity and measured 48 h after transfection. Values are means ± standard error of mean from three independent exper- iments. *P<0.05, **P<0.01, ns; not significant, from the Dunnett multiple comparisons test. STF: stem cell factor, thrombopoietin and Flt-3 ligand; SE: stem cell fac- tor plus erythropoietin; SFM: stem cell factor, Flt-3 ligand and monocyte colony-stimulating factor.
1524
haematologica | 2020; 105(6)
