
Page 62 - Haematologica - Vol. 105 n. 6 - June 2020
P. 62
L.A. Richards et al.
of culture in STF. TERT expression then returned to the low basal levels detected in unstimulated HSPC when the culture was switched to SE (weeks 2-3). In contrast to TERT, DKC1 expression was induced after cultures were switched to SE. The kinetics of DKC1 upregulation varied among the CB cultures established from different individ- uals, but invariably increased after the switch to erythroid conditions at week 1 and peaked at either week 2 or 3 of culture (Online Supplementary Figure S2). The DKC1 expression pattern closely paralleled erythroid commit-
AB
ment and expansion, as indicated by expression of GLYA+ (Figure 1A). Expression of TERC did not alter dramatically over the time course, apart from a modest increase from week 1 to 2 of culture.
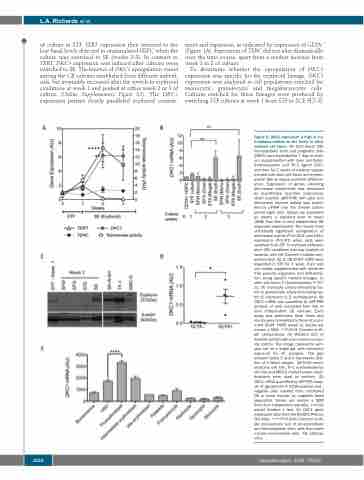
To determine whether the upregulation of DKC1 expression was specific for the erythroid lineage, DKC1 expression was analyzed in cell populations enriched for monocytic, granulocytic and megakaryocytic cells. Cultures enriched for these lineages were produced by switching STF cultures at week 1 from STF to SCF, FLT-3L
Figure 2. DKC1 expression is high in ery- throblasts relative to the levels in other myeloid cell types. (A) Cord blood (CB) hematopoietic stem and progenitor cells (HSPC) were expanded for 7 days in medi- um supplemented with stem cell factor, thrombopoietin and Flt-3 ligand (STF), and then for 2 weeks in medium supple- mented with stem cell factor and erythro- poietin (SE) to induce erythroid differenti- ation. Expression of genes encoding telomerase components was measured by quantitative real-time polymerase chain reaction (qRT-PCR) (left axis) and telomerase enzyme activity was quanti- fied by qTRAP over the 3-week culture period (right axis). Values are presented as means ± standard error of mean (SEM) from five to nine independent CB expansion experiments. The results show statistically significant upregulation of telomerase activity (P<0.0001) and DKC1 expression (P<0.01) when cells were switched from STF to erythroid differenti- ation (SE) conditions (two-way analysis of variance with the Dunnett multiple com- parison test). (B, C) CB CD34+ HSPC were expanded in STF for 1 week, then split into media supplemented with cytokines that promote expansion and differentia- tion along specific myeloid lineages. S: stem cell factor; T: thrombopoietin; F: FLT- 3L; M: monocyte colony-stimulating fac- tor; G: granulocyte colony-stimulating fac- tor; 6: interleukin 6; E: erythropoietin. (B) DKC1 mRNA was quantified by qRT-PCR analysis of cells harvested from five to nine independent CB cultures. Each assay was performed three times and results were normalized to those of uncul- tured CD34+ HSPC (week 0). Values are means ± SEM. **P<0.01 Dunnett multi- ple comparisons. (C) Western blot of dyskerin protein with actin used as a load- ing control. The image represents sam- ples run on a single gel, with consistent exposure for all samples. The gap between lanes 5 and 6 represents dele- tion of a failed sample. SK-N-SH neuro- blastoma cell line, TF-1 erythroleukemia cell line and MRC-5 mortal human myofi- broblasts were used as controls. (D) DKC1 mRNA quantified by qRT-PCR analy- sis of glycophorin A (GLYA)-positive and - negative cells isolated from uncultured CB or bone marrow by magnetic bead separation. Values are means ± SEM from four independent samples. P<0.05 paired Student t test. (E) DKC1 gene expression data from the BioGPS Primary Cell Atlas. ****P<0.0001 Dunnett multi- ple comparisons test of proerythroblast and hematopoietic stem cells from bone marrow mononuclear cells. AU: arbitrary units.
CD
E
1520
haematologica | 2020; 105(6)
