
Page 268 - Haematologica - Vol. 105 n. 6 - June 2020
P. 268
K. Halaburda et al.
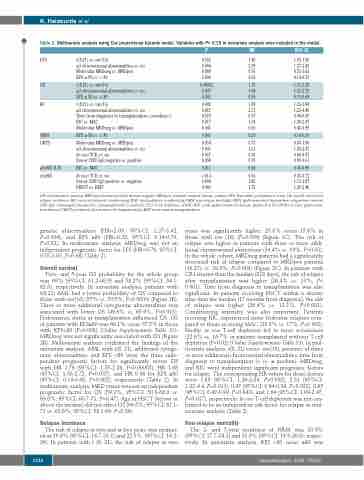
Table 2. Multivariate analysis using Cox proportional hazards model. Variables with P< 0.15 in univariate analysis were included in the model. P HR 95%CI
LFS
OS
RI
NRM GRFS
aGvHD II-IV cGvHD
t(8;21) vs. inv(16)
≥3 chromosomal abnormalities vs. no Molecular MRDneg vs. MRDpos
KPS ≥ 80 vs. < 80
t(8;21) vs. inv(16)
≥3 chromosomal abnormalities vs. no KPS≥ 80vs.<80
t(8;21) vs. inv(16)
≥3 chromosomal abnormalities vs. no
Time from diagnosis to transplantation (>median>) RIC vs. MAC
Molecular MRDneg vs. MRDpos
KPS≥ 80vs.<80
Molecular MRDneg vs. MRDpos
≥3 chromosomal abnormalities vs. no In vivo TCD vs. no
Donor CMV IgG negative vs. positive
RIC vs. MAC
In vivo TCD vs. no
Donor CMV IgG positive vs. negative PBSCT vs. BMT
0.022 1.40 0.004 2.09 0.080 0.76 0.006 0.32
0.00002 1.76 0.037 1.68 0.002 0.36
0.002 1.89 0.011 2.31 0.023 0.97 0.017 1.64 0.043 0.65
0.001 0.29
0.054 0.77 0.031 1.61 0.027 0.76 0.058 0.79
0.011 0.64
<10-5 0.56 0.004 1.45 0.003 1.72
1.05-1.86 1.27-3.42 0.55-1.03 0.14-0.73
1.35-2.28 1.03-2.72 0.19-0.68
1.26-2.84 1.23-4.40 0.94-0.99 1.09-2.47 0.42-0.99
0.14-0.59
0.60-1.00 1.04-2.47 0.60-0.97 0.99-1.61
0.45-0.90
0.43-0.72 1.13-1.87 1.20-2.46
LFS: leukemia-free survival; MRDneg: minimal residual disease negative; MRDpos: minimal residual disease positive; KPS: Karnofsky performance score; OS: overall survival; RI: relapse incidence; RIC: reduced intensity conditioning; MAC: myeloablative conditioning; NRM: non-relapse mortality; GRFS: graft-versus-host disease-free, relapse-free survival; CMV IgG: cytomegalovirus-specific immunoglobulin G antibody; TCD: T-cell depletion; aGvHD II-IV: acute graft-versus-host disease, grades II to IV;cGVHD: chronic graft-versus- host disease; PBSCT: peripheral blood stem cell transplantation; BMT: bone marrow transplantation.
genetic abnormalities (HR=2.09, 95%CI: 1.27-3.42, P=0.004), and KPS ≥80 (HR=0.32; 95%CI: 0.14-0.73, P=0.32). In multivariate analysis, MRDneg was not an independent prognostic factor for LFS (HR=0.76; 95%CI: 0.55-1.03, P=0.08) (Table 2).
Overall survival
Two- and 5-year OS probability for the whole group was 65% (95%CI: 61.2-68.9) and 58.2% (95%CI: 54.1- 62.3), respectively. In univariate analysis, patients with t(8;21) AML had a lower probability of OS compared to those with inv(16) (57% vs. 70.5%, P=0.0003) (Figure 1B). Three or more additional cytogenetic abnormalities was associated with lower OS (49.6% vs. 65.9%, P=0.013). Performance status at transplantation influenced OS. OS of patients with KPS≥80 was 66.1% versus 37.5% in those with KPS<80 (P=0.003) (Online Supplementary Table S3). MRDneg was not significantly associated with OS (Figure 2B). Multivariate analysis confirmed the findings of the univariate analysis. AML with t(8; 21), additional cytoge- netic abnormalities, and KPS <80 were the three inde- pendent prognostic factors for significantly worse OS with HR 1.76 (95%CI: 1.35-2.28, P=0.00002), HR 1.68 (95%CI: 1.03-2.72, P=0.037), and HR 0.36 for KPS ≥80 (95%CI: 0.19-0.68, P=0.002), respectively (Table 2). In multivariate analysis, MRD status was not an independent prognostic factor for OS (59.9%; 95%CI: 50.8-68.9 vs. 65.8%; 95%CI: 60.7-71, P=0.47). Age at HSCT (below or above the median) did not affect OS (66.5%; 95%CI: 61.1- 71 vs. 63.6%; 95%CI: 58.1-69, P=0.39).
Relapse incidence
The risk of relapse at two and at five years was estimat- ed at 19.8% (95%CI: 16.7-23.1) and 22.5% (95%CI: 19.2- 26). In patients with t (8; 21), the risk of relapse at two
years was significantly higher: 25.8% versus 15.6% in those with inv (16) (P=0.009) (Figure 1C). The risk of relapse was higher in patients with three or more addi- tional chromosomal aberrations (34.4% vs. 19%, P=0.03). In the whole cohort, MRDneg patients had a significantly decreased risk of relapse compared to MRDpos patients (16.2% vs. 29.3%, P=0.003) (Figure 2C). In patients with CR1 shorter than the median (318 days), the risk of relapse after transplantation was higher (26.4% vs. 13%, P< 0.001). Time from diagnosis to transplantation was also significant. In patients receiving HSCT within a shorter time than the median (17 months from diagnosis), the risk of relapse was higher (26.4% vs. 13.1%, P<0.001). Conditioning intensity was also important. Patients receiving RIC experienced more leukemia relapses com- pared to those receiving MAC (25.9% vs. 17%, P=0.002). Finally, in vivo T-cell depletion led to more recurrences (22.6% vs. 16.7% in patients transplanted without T-cell depletion (P=0.02) (Online Supplementary Table S3). In mul- tivariate analysis, t(8; 21) versus inv(16), presence of three or more additional chromosomal abnormalities, time from diagnosis to transplantation (> vs. ≤ median), MRDneg, and RIC were independent significant prognostic factors for relapse. The corresponding HR values for those factors were 1.89 (95%CI; 1.26-2.84, P=0.002), 2.31 (95%CI: 1.23-4.4, P=0.011), 0.97 (95%CI: 0.94-0.99, P=0.023), 0.65 (95%CI: 0.42-0.99, P=0.043), and 1.64 (95%CI: 1.09-2.47, P=0.017), respectively. In vivo T-cell depletion was not con- firmed to be an independent risk factor for relapse in mul- tivariate analysis (Table 2).
Non-relapse mortality
The 2- and 5-year incidence of NRM was 20.9% (95%CI: 17.7-24.2) and 23.3% (95%CI: 19.9-26.8), respec- tively. In univariate analysis, KPS <80 versus ≥80 was
1726
haematologica | 2020; 105(6)
