
Page 267 - Haematologica - Vol. 105 n. 6 - June 2020
P. 267
Allogeneic transplantation for CBF AML
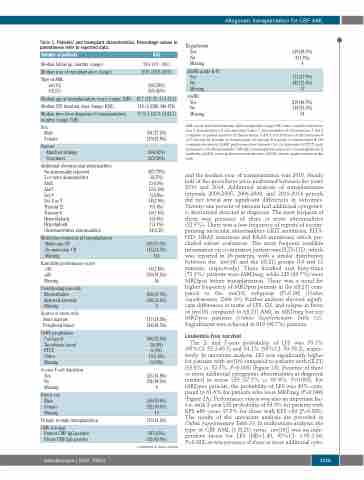
Table 1. Patients’ and transplant characteristics. Percentage values in parentheses refer to reported data.
Engraftment Yes
No Missing
619(98.7%) 8(1.3%) 4
Number of patients
Median follow up, months (range)
Median year of transplantation (range)
Type of AML inv(16) t(8;21)
Median age at transplantation, years (range; IQR)
Median CR1 duration, days (range; IQR)
Median time from diagnosis to transplantation,
months (range; IQR)
Sex Male
Female
Donors
Matched siblings Unrelated
Additional chromosomal abnormalities No abnormality reported
3 or more abnormalities
Abn5
Abn7
Del 9
DelXorY
Trisomy 22
Trisomy 8
Hyperdiploidy
Hypodiploidy
Undefined/other abnormalities
Molecular remission at transplantation Molecular CR
No molecular CR
Missing
Karnofsky performance score <80
≥80 Missing
Conditioning intensity Myeloablative Reduced intensity Missing
Source of stem cells Bone marrow Peripheral blood
GvHD prophylaxis CsA based Tacrolimus based PTCY
Other
Missing
In vivo T-cell depletion Yes
No Missing
Donor sex Male
Female
Missing
Female to male transplantation
CMV serology
Patient CMV IgG positive Donor CMV IgG positive
631
59.6 (0.9 - 201)
2010 (2000-2014)
366(58%) 265(42%)
41.7 (18 -73; 31.3-51.2) 318 (6-2380; 246-474) 17 (3.5-222.9; 14-22.5)
361(57.2%) 270(42.8%)
264(42%)
367(58%)
497(79%) 32(5%) 2(0.3%) 10(1.6%) 5(0.8%) 18(2.9%) 9(1.4%) 10(1.6%) 4(0.6%) 7(1.1%) 34(5.39)
343(73.3%) 125(26.7%) 163
16(2.8%) 559(97.2%) 56
424(67.5%) 204(32.5%) 3
117(18.5%) 514(81.5%)
584(92.6%) 26(4%) 6(1%) 10(1.6%) 5(0.8%)
325(51.8%) 302(48.2%) 4
369(59.4%) 252(40.6%) 10
133(21.2%)
387(63%)
305(49.9%)
continued in next column
aGvHD grade II-IV
Yes 171(27.9%) No 443(72.1%) Missing 17
cGvHD Yes No
Missing
279(46.7%) 318(53.3%) 34
AML: acute myeloid leukemia; IQR: interquartile range; CR1: first complete remission; abn 5: abnormalities of chromosome 5; abn 7: abnormalities of chromosome 7; del 9 complete or partial deletion of chromosome 9; del X or Y, deletion of chromosome X or Y; trisomy 22: trisomy of chromosome 22; trisomy 8: trisomy of chromosome 8; CR: complete remission; GvHD: graft-versus-host disease; CsA: cyclosporine A; PTCY: post- transplant cyclophosphamide; CMV IgG: cytomegalovirus-specific immunoglobulin G antibody; aGvHD: acute graft-versus-host disease; cGvHD: chronic graft-versus-host dis- ease.
and the median year of transplantation was 2010. Nearly half of the procedures were performed between the years 2010 and 2014. Additional analysis of transplantation intervals 2000-2005, 2006-2009, and 2010-2014 periods did not reveal any significant differences in outcomes. Twenty-one percent of patients had additional cytogenet- ic aberrations detected at diagnosis. The most frequent of them was presence of three or more abnormalities (32.5%). There was a low frequency of reports of accom- panying molecular abnormalities (cKIT mutations, FLT3- ITD, NRAS mutations and KRAS mutations) which pre- cluded subset evaluation. The most frequent available information on co-mutation pattern was FLT3-ITD, which was reported in 26 patients, with a similar distribution between the inv(16) and the t(8;21) groups (14 and 12 patients, respectively). Three hundred and forty-three (73.3%) patients were MRDneg, while 125 (26.7%) were MRDpos before transplantation. There was a trend for higher frequency of MRDpos patients in the t(8;21) com- pared to the inv(16) subgroup (P=0.06) (Online Supplementary Table S1). Further analysis showed signifi- cant differences in terms of LFS, OS, and relapse in favor of inv(16) compared to t(8;21) AML in MRDneg but not MRDpos patients (Online Supplementary Table S2). Engraftment was achieved in 619 (98.7%) patients.
Leukemia-free survival
The 2- and 5-year probability of LFS was 59.1% (95%CI: 55.2-63.1) and 54.1% (95%CI: 50-58.2), respec- tively. In univariate analysis, LFS was significantly higher for patients with inv(16) compared to patients with t(8;21) (63.8% vs. 52.5%, P=0.003) (Figure 1A). Presence of three or more additional cytogenetic abnormalities at diagnosis resulted in worse LFS (37.5% vs. 60.4%, P=0.002). For MRDpos patients, the probability of LFS was 49% com- pared to 61.6% for patients who were MRDneg (P=0.046) (Figure 2A). Performance status was also an important fac- tor, with 2-year LFS probability of 59.9% for patients with KPS ≥80 versus 37.5% for those with KPS <80 (P=0.003). The results of the univariate analysis are provided in Online Supplementary Table S3. In multivariate analysis, the type of CBF AML [t (8;21) versus inv(16)] was an inde- pendent factor for LFS (HR=1.40, 95%CI: 1.05-1.86, P=0.022) as was presence of three or more additional cyto-
haematologica | 2020; 105(6)
1725
