
Page 250 - Haematologica - Vol. 105 n. 6 - June 2020
P. 250
C. Giaccherini et al.
(pmol/L) (sensitivity=61%, specificity=53%). Kaplan- Meier analysis showed that in patients with F1+2 levels above the cut-off, cumulative incidence of DR was 14.7 % (95%CI:10.2-19.2) and was significantly (P<0.05) higher than in patients with F1+2 levels ≤ cut-off (8.7%; 95%CI: 5.4-12). A multivariate Cox regression analysis, stratified for age, was carried out testing for clinico-pathological co- variates (Body Mass Index, smoking habit, infection, molecular subtype, tumor size, lymph node status, use of anticoagulant/anti-platelet agents, and type of surgery). After backward selection, only increased F1+2 value (HR 2; 95%CI: 1.1-3.6; P=0.019), tumor size ≥ 5cm (HR 2.6; 95%CI:1.4-4.6; P=0.001), and having Luminal B HER2-neg or TN molecular subtypes (HR 3.9; 95%CI: 2.1-7.5; P<0.001) were identified as independent risk factors for DR.
To exclude any influence of the pre-analytical phase on biomarkers levels, we performed the multivariate Cox regression analysis stratifying for recruiting centers. Results confirmed F1+2, tumor size and molecular subtypes as sig- nificant independent risk factors for DR.
The co-efficients of the multivariate analysis for each independent co-variate were used to generate a risk assess- ment score, as follows: F1+2 > 202.5 pmol/L = +1, tumor
size ≥ 5cm = +1.3, Luminal B HER2-neg and TN molecular subtypes= +2. After score calculation, a ROC curve analy- sis was performed to evaluate the contribution of score value for DR (Online Supplementary Figure S2). The area under the curve was 0.72. The risk groups were created using a cut-off value of 2.65 points (sensitivity=66%, speci- ficity=67%). Kaplan Meier curves according to risk groups are shown in Figure 3. Cumulative incidence of DR was 6.2% (IC 95%: 3.6-8.7) and 20.7% (IC 95%: 14.8-26.6), in the low-risk (score<3) and high-risk (score≥3) groups, respectively (HR 3.5; 95%CI: 2.1-6.0; P<0.001).
Discussion
In this large, prospective cohort study of 701 patients with early stage, surgically resected, high-risk breast can- cer, enrolled in the HYPERCAN study, we characterized the baseline hypercoagulability status before starting sys- temic chemotherapy and investigated the capacity of plasma thrombotic biomarkers to predict DR. This repre- sents the first large prospective study specifically designed to assess hemostatic activation and its association with recurrence risk in breast cancer patients.
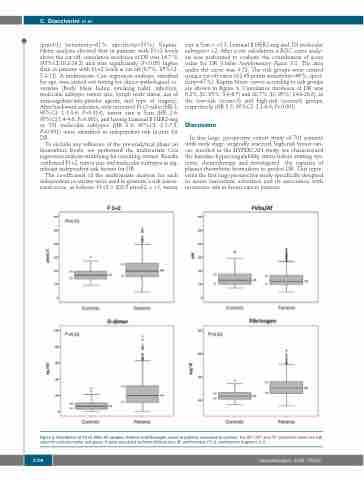
Figure 2. Distribution of F1+2, FVIIa-AT complex, D-dimer and fibrinogen values in patients compared to controls. The 25th, 50th and 75th percentile values are indi- cated for each biomarker and group. P-value calculated by Mann-Whitney test. AT: antithrombin; F1+2: prothrombin fragment 1+2.
1708
haematologica | 2020; 105(6)
