
Page 83 - Haematologica May 2020
P. 83
Extensive mixed chimerism analysis in sickle cell disease post HSCT
in the Online Supplementary Figure S1.
Hemoglobin levels (overall median [range] concentra-
tion: 12.9 g/dL [8.4-14.4]) were generally stable and clini- cally satisfactory. Median Hb level was lower in group 1 (10.8 g/dL) than in group 2 (13.1 g/dL) or group 3 (12.9 g/dL), although the difference was not statistically signifi- cant (P=0.18). There was no difference in the mean Hb level between the set of patients with an AS donor (medi- an [range] 12.8 g/dL [8.4-14.3]) and the set with a non-AS donor (median [range] 13.1 g/dL [9.6-14.4]) (P=0.61). A reticulocyte count at last follow-up greater than 100x109/L was observed in patients with WBC donor chimerism <50%. However, this was associated with Hb levels <10 g/dL solely in patients with AS donor (see below).
The HbS fractions in patients after HSCT were similar to those of the donors, with the exception of the six patients with donor chimerism <50% (see below). With the exception of patient #2 (who experienced a single vaso- occlusive crisis (VOC) with confirmed liver involvement; see below), no VOC were observed after transplantation.
Donor chimerism in mature myeloid and lymphoid cells, and in granulomonocytic progenitors
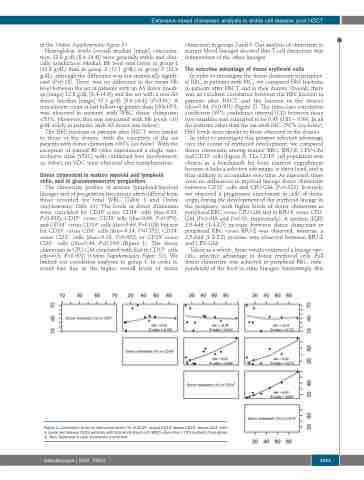
The chimerism profiles of mature lymphoid/myeloid lineages and of progenitors/precursors often differed from those recorded for total WBC (Table 1 and Online Supplementary Table S1). The levels of donor chimerism were correlated for CD15+ versus CD14+ cells (rho=0.93, P=0.002), CD15+ versus CD19+ cells (rho=0.66, P=0.076), and CD14+ versus CD19+ cells (rho=0.69, P=0.028) but not for CD15+ versus CD3+ cells (rho=-0.14, P=0.752), CD14+ versus CD3+ cells (rho=-0.18, P=0.632) or CD19+ versus CD3+ cells (rho=0.44, P=0.199) (Figure 1). The donor chimerism in CFU-GM correlated with that in CD15+ cells (rho=0.8, P<0.001) (Online Supplementary Figure S2). We limited our correlation analyses to group 1, in order to avoid bias due to the higher overall levels of donor
chimerism in groups 2 and 3. Our analysis of chimerism in mature blood lineages showed that T-cell chimerism was independent of the other lineages.
The selective advantage of donor erythroid cells
In order to investigate the donor chimerism in peripher- al RBC in patients with MC, we compared HbS fractions in patients after HSCT and in their donors. Overall, there was an excellent correlation between the HbS fraction in patients after HSCT and the fraction in the donors (rho=0.94, P<0.001) (Figure 2). The intra-class correlation coefficient (95% confidence interval [CI]) between these two variables was estimated to be 0.95 (0.81 – 0.99). In all the patients other than the six with MC <50% (see below), HbS levels were similar to those observed in the donors.
In order to investigate this putative selective advantage over the course of erythroid development, we compared donor chimerism among mature RBC, BFU-E, CFU-GM and CD15+ cells (Figure 3). The CD15+ cell population was chosen as a benchmark for bone marrow engraftment because it lacks a selective advantage, is short-lived, and is thus unlikely to accumulate over time. As expected, there were no differences in myeloid lineage donor chimerism between CD15+ cells and CFU-GM (P=0.313). Inversely we observed a progressive enrichment in cells of donor origin during the development of the erythroid lineage in the periphery, with higher levels of donor chimerism in peripheral RBC versus CFU-GM and in BFU-E versus CFU- GM (P=0.016 and P=0.03, respectively). A median (IQR) 2.0-fold (1.4-2.5) increase between donor chimerism in peripheral RBC versus BFU-E was observed, whereas, a 1.5-fold (1.2-2.2) increase was observed between BFU-E and CFU-GM.
Taken as a whole, these results evidenced a lineage-spe- cific, selective advantage in donor erythroid cells. Full donor chimerism was achieved in peripheral RBC, inde- pendently of the level in other lineages. Interestingly, this
Figure 1. Correlation of donor chimerism levels (%) in CD15+ versus CD14+ versus CD19+ versus CD3+ cells in sickle cell disease (SCD) patients with total white blood cell (WBC) chimerism <70% (patients from group 1). Rho: Spearman's rank correlation coefficient.
haematologica | 2020; 105(5)
1243
