
Page 82 - Haematologica May 2020
P. 82
A. Magnani et al.
Results
The study population and clinical outcomes
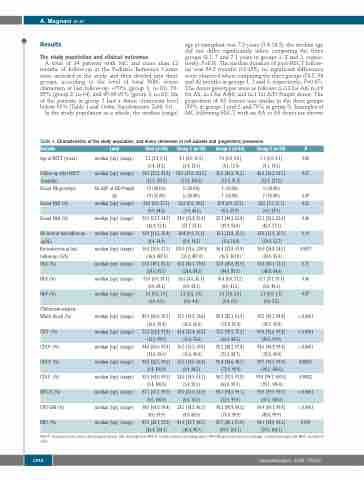
A total of 34 patients with MC and more than 12 months of follow-up at the Pediatric Reference Center were included in the study and then divided into three groups, according to the level of total WBC donor chimerism at last follow-up: <70% (group 1, n=10), 70- 95% (group 2, n=14), and 95-99.95% (group 3, n=10). Six of the patients in group 1 had a donor chimerism level below 50% (Table 1 and Online Supplementary Table S1).
In the study population as a whole, the median (range)
age at transplant was 7.2 years (3.4-14.2); the median age did not differ significantly when comparing the three groups (8.1, 7 and 7.1 years in groups 1, 2 and 3, respec- tively; P=0.8). The median duration of post-HSCT follow- up was 54.5 months (12-155); no significant differences were observed when comparing the three groups (58.5, 56 and 42 months in groups 1, 2 and 3, respectively; P=0.67). The donor genotypes were as follows: n=13 for AA, n=19 for AS, n=1 for A/β0, and n=1 for A/D-Punjab donor. The proportion of AS donors was similar in the three groups (50% in groups 1 and 2, and 70% in group 3). Examples of MC following HSCT with an AA or AS donor are shown
Table 1. Characteristics of the study population, and donor chimerism in cell subsets and progenitors/precursors.
Variable
Age at HSCT (years)
Follow-up after HSCT
(months)
Donor Hb genotype
Donor HbS (%)
Donor HbA (%)
Hb level at last follow-up
(g/dL) Reticulocytes at last follow-up (G/L) HbA (%)
HbS (%)
HbF (%)
Chimerism analysis Whole blood (%)
CD3+ (%)
CD19+ (%)
CD14+ (%)
CD15+ (%)
BFU-E (%)
CFU-GM (%)
RBC (%)
Level
median [iqr] (range)
median [iqr] (range)
AA, A/β0 or A/D-Punjab AS
median [iqr] (range)
median [iqr] (range)
median [iqr] (range)
median [iqr] (range)
median [iqr] (range)
median [iqr] (range)
median [iqr] (range)
median [iqr] (range)
median [iqr] (range)
median [iqr] (range)
median [iqr] (range)
median [iqr] (range)
median [iqr] (range)
median [iqr] (range)
median [iqr] (range)
Total (n=34)
7.2 [5.8, 9.1] (3.4, 14.2) 54.5 [37.2, 81.8] (12.0, 155.0) 15 (44.1%) 19 (55.9%) 32.0 [0.0, 37.5] (0.0, 44.6) 53.0 [51.7, 54.7] (46.9, 57.4) 12.9 [11.5, 13.4] (8.4, 14.4) 36.0 [30.0, 57.3] (16.5, 407.0) 53.8 [49.2, 82.3] (24.0, 87.5) 33.0 [0.0, 38.1] (0.0, 68.1) 1.0 [0.0, 1.9] (0.0, 6.5)
89.3 [60.0, 95.7] (16.0, 99.8) 73.5 [58.8, 91.8] (12.0, 99.9) 94.0 [56.0, 97.8] (11.0, 99.9) 96.5 [52.5, 99.6] (9.4, 100.0) 95.0 [64.0, 99.5] (5.4, 100.0) 97.7 [65.5, 99.9] (0.0, 100.0) 98.0 [64.0, 99.4] (8.0, 99.9) 87.5 [82.7, 97.2]
(46.4, 104.1)
Group 1 (n=10)
8.1 [6.0, 10.5] (3.4, 12.5) 58.5 [37.0, 122.5] (21.0, 155.0)
5 (50.0%)
5 (50.0%) 16.6 [0.0, 38.5] (0.0, 44.6) 54.0 [52.8, 55.4] (51.7, 57.4) 10.8 [9.9, 13.1] (8.4, 14.2) 135.0 [38.6, 209.5] (31.2, 407.0) 66.2 [45.1, 79.8] (24.0, 84.5) 20.6 [4.6, 45.1] (0.0, 68.1)
1.2 [0.2, 1.8] (0.0, 4.4)
37.0 [19.5, 56.0]
(16.0, 66.0)
41.8 [31.8, 45.5]
(12.0, 70.0)
36.5 [15.5, 49.8]
(11.0, 90.0)
33.5 [18.5, 56.8]
(9.4, 98.5)
24.5 [14.5, 51.2]
(5.4, 95.0)
39.0 [31.0, 61.0]
(0.0, 76.0)
38.5 [14.5, 46.5]
(8.0, 60.0)
81.6 [79.7, 84.5]
(46.4, 98.7)
Group 2 (n=14)
7.0 [6.0, 8.6] (4.1, 12.5) 56.0 [46.8, 76.2] (12.0, 91.0) 7 (50.0%)
7 (50.0%)
15.8 [0.0, 35.7]
(0.0, 39.8) 52.7 [49.2, 53.8] (47.9, 54.8) 13.1 [12.8, 13.3]
(9.6, 14.4) 36.4 [27.8, 55.8] (16.5, 161.0) 53.8 [49.0, 85.9] (44.0, 87.5) 16.4 [0.0, 37.2] (0.0, 41.2) 1.0 [1.0, 2.6] (0.0, 6.5)
89.3 [85.3, 91.9] (72.0, 93.4) 73.5 [70.5, 77.2] (63.0, 88.5)
95.2 [88.2, 97.8]
(73.0, 98.7)
96.4 [94.6, 98.5]
(72.0, 99.9)
96.2 [92.5, 97.8]
(63.0, 99.9)
98.1 [94.5, 99.1]
(52.0, 99.9)
98.2 [89.8, 99.2]
(76.0, 99.9)
89.7 [86.1, 97.0]
(47.9, 101.5)
Group 3 (n=10)
7.1 [5.0, 9.1] (4.1, 14.2) 42.0 [36.2, 92.5] (12.0, 127.0) 3 (30.0%)
7 (70.0%) 33.6 [7.9, 37.7] (0.0, 38.7) 53.3 [52.2, 55.2] (46.9, 57.3) 12.9 [11.9, 13.5] (10.9, 13.7) 30.0 [24.8, 34.5] (20.6, 55.0) 53.0 [50.1, 73.1] (48.8, 84.0) 33.7 [8.1, 39.1] (0.0, 40.3) 1.1 [0.0, 1.7] (0.0, 5.5)
97.2 [96.3, 98.8] (95.7, 99.8) 93.8 [92.6, 97.4] (89.0, 99.9) 98.6 [96.9, 99.4] (93.5, 99.9) 99.7 [99.5, 99.9] (98.2, 100.0) 99.8 [99.7, 100.0] (95.1, 100.0) 99.9 [99.9, 99.9] (97.2, 100.0)
99.4 [99.1, 99.8]
(80.0, 99.9)
94.1 [84.9, 99.2]
(79.0, 104.1)
P
0.80
0.67
0.69
0.62
0.46
0.19
0.0037
0.71
0.46
0.87
< 0,0001
< 0,0001
< 0,0001
0.00013
0.00022
< 0,0001
< 0,0001
0.039
HSCT : hematopoietic stem cell transplantation ; Hb: hemoglobin; BFU-E: erythroid burst forming units; CFU-GM: granulocyte-macrophage colony-forming-units; RBC: red blood cells.
1242
haematologica | 2020; 105(5)
