
Page 75 - Haematologica May 2020
P. 75
Iron absorption from oral supplements in anemia
between-group differences in age, body mass index (BMI) or iron and inflammatory parameters at days 1 and 22 (Table 1).
Hepcidin profiles and iron absorption during daily and intermittent oral iron dosing
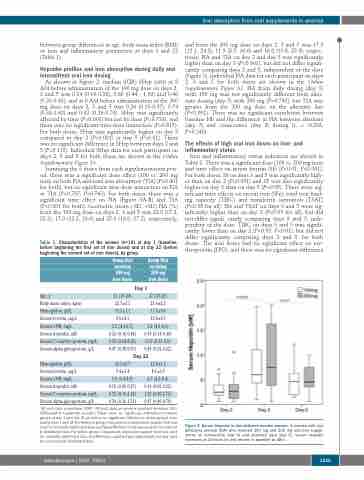
As shown in Figure 2, median (IQR) SHep (nM) at 8 AM before administration of the 100 mg dose on days 2, 3 and 5 was 0.24 (0.19-0.38), 0.60 (0.44 - 1.09) and 0.46 (0.20-0.62), and at 8 AM before administration of the 200 mg dose on days 2, 3 and 5 was 0.26 (0.13-0.37), 0.74 (0.38-1.62) and 0.42 (0.29-0.74). SHep was significantly affected by time (P<0.001) but not by dose (P=0.733), and there was no significant time-dose interaction (P=0.815). For both doses, SHep was significantly higher on day 3 compared to day 2 (P<0.001) or day 5 (P<0.01). There was no significant difference in SHep between days 2 and 5 (P=0.115). Individual SHep data for each participant on days 2, 3 and 5 for both doses are shown in the Online Supplementary Figure S1.
Summing the 3 doses from each supplementation peri- od, there was a significant dose effect (100 vs. 200 mg iron) on both FIA and total iron absorption (TIA) (P<0.001 for both), but no significant time-dose interaction on FIA or TIA (P=0.737; P=0.763). For both doses, there was a significant time effect on FIA (Figure 3A-B) and TIA (P<0.001 for both). Geometric mean (-SD, +SD) FIA (%) from the 100 mg dose on days 2, 3 and 5 was 23.5 (17.2, 32.2), 17.0 (12.3, 23.6) and 25.0 (16.8, 37.2), respectively,
Table 1. Characteristics of the women (n=19) at day 1 (baseline, before beginning the first set of iron doses) and at day 22 (before beginning the second set of iron doses), by group.
andfromthe200mgdoseondays2,3and5was17.3 (12.1, 24.8), 11.9 (8.5, 16.6) and 16.8 (10.8, 25.9), respec- tively. FIA and TIA on day 2 and day 5 was significantly higher than on day 3 (P<0.001), but did not differ signifi- cantly comparing days 2 and 5, independent of the dose (Figure 3). Individual FIA data for each participant on days 2, 3 and 5 for both doses are shown in the Online Supplementary Figure S2. FIA from daily dosing (day 3) with 100 mg was not significantly different from alter- nate dosing (day 5) with 200 mg (P=0.792), but TIA was greater from the 200 mg dose on the alternate day (P<0.001). There was no significant correlation between baseline Hb and the difference in FIA between alternate (day 5) and consecutive (day 3) dosing (rS = -0.292; P=0.240).
The effects of high oral iron doses on iron- and inflammatory status
Iron and inflammatory status indicators are shown in Table 2. There was a significant dose (100 vs. 200 mg iron) and time effect on serum ferritin (SF) (P<0.01, P<0.001). For both doses, SF on days 3 and 5 was significantly high- er than on day 2 (P<0.001) and SF was also significantly higher on day 3 than on day 5 (P<0.05). There were sig- nificant time effects on serum iron (SFe), total iron bind- ing capacity (TIBC) and transferrin saturation (TSAT) (P<0.05 for all). SFe and TSAT on days 3 and 5 were sig- nificantly higher than on day 2 (P<0.05 for all), but did not differ signifi cantly comparing days 3 and 5, inde- pendent of the dose. TIBC on days 3 and 5 was signifi- cantly lower than on day 2 (P<0.05, P<0.01), but did not differ significantly comparing days 3 and 5, for both doses. The iron doses had no significant effect on ery- thropoietin (EPO), and there was no significant difference
Figure 2. Serum hepcidin in iron-deficient anemic women. In women with iron deficiency anemia (IDA) who received 100 mg and 200 mg oral iron supple- ments on consecutive (day 3) and alternate days (day 5), serum hepcidin increases at 24 hours (h) and returns to baseline by 48 h .
Group first receiving 100 mg iron doses
Group first receiving 200 mg
iron doses
22 (20-26) 21.6±2.2 11.6±0.6 12.0±4.7 5.2 (4.5-6.3) 0.19 (0.14-0.44) 0.37 (0.13-4.0) 0.49 (0.32-0.62)
Day 1
Age, y1
Body mass index, kg/m2 Hemoglobin, g/dL
Serum ferritin, mg/L
Serum sTfR, mg/L
Serum hepcidin, nM
Serum C-reactive protein, mg/L Serum alpha glycoprotein, g/L
21 (19-24) 22.7±2.3 11.3±1.1 9.6±4.3
5.2 (4.5-6.7) 0.32 (0.16-0.44) 0.50 (0.34-8.35) 0.47 (0.38-0.59)
Day 22
Hemoglobin, g/dL
12.1±0.7
9.4±3.4
5.9 (5.4-8.8)
0.10 (0.06-0.27)
0.25 (0.16-2.14)
0.54 (0.36-1.21)
12.0±1.2
8.1±3.9
6.7 (4.5-8.4)
0.16 (0.02-0.22)
1.23 (0.30-2.75)
0.47 (0.40-0.79)
Serum ferritin, mg/L
Serum sTfR, mg/L
Serum hepcidin, nM
Serum C-reactive protein, mg/L
Serum alpha glycoprotein, g/L
1All such data as medians (IQR). 2All such data as means ± standard deviation (SD). sTFR=soluble transferrin receptor. There were no significant differences between groups at day 1 and day 22, as well as no significant differences within groups com- paring days 1 and 22.For between group comparisons,independent sample t-test was used for normally distributed data and Mann-Whitney U test was used for not normal- ly distributed data. For within group comparisons, dependent sample t-test was used for normally distributed data and Wilcoxon matched-pair signed-rank test was used for not normally distributed data.
haematologica | 2020; 105(5)
1235
