
Page 65 - Haematologica May 2020
P. 65
Long-term outcome of ATG & CSA ± G-CSF in SAA
kidney disease because of the treatment with ATG and CSA.22,23 Furthermore, for patients with aseptic osteonecrosis we com- pared those who needed more than one course of ATG and were therefore more exposed to steroids, to those treated with a single course of ATG; for patients with chronic kidney disease we com- pared patients who were either dependent on CSA or needed a subsequent course of CSA to those who received a single course of ATG without being dependent on CSA. Time to an event started from the day of randomization, except for survival of patients treated with SCT. For OS, patients were censored either at the time of last follow-up or at the time of transplantation, used as salvage therapy. For EFS analysis, events were defined as relapse, non-response at day 120, subsequent SCT, the occur- rence of MDS/AML, solid cancer, clinical PNH or death.
Statistical analysis
Group differences were analyzed with the use of the Mann- Whitney U test for continuous variables and the χ2 test for cate- gorical variables. Survival probabilities were calculated with the
use of the Kaplan-Meier estimator. Time at risk started from the date of randomization and ended on the date of death for OS, and on the date of an event for EFS, or the date of last known assessment, whichever came first. For the cumulative incidence of a late complication, death from other cause was considered as a competing risk. The log-rank test with a two-sided significance level was used for comparison in the Kaplan-Meier estimates. The time to an event was computed from the date of random- ization to the date of death or the date of last contact. Univariate competing risk analyses were performed using the Gray test. Multivariate analysis was performed to calculate hazard ratios and their 95% confidence intervals, adjusted for all covariates, using a Cox proportional hazards regression model. Factors con- sidered were age at randomization, severity of aplastic anemia and the use of G-CSF. All P-values are two-sided with a type I error rate fixed at 0.05. Statistical analyses were performed with SPSS Statistic 25 software (IBM Corp., Chicago, IL, USA); cumu- lative incidence curves were constructed with NCSS 2004 (Statistics and Systems, Kaysville, UT, USA).
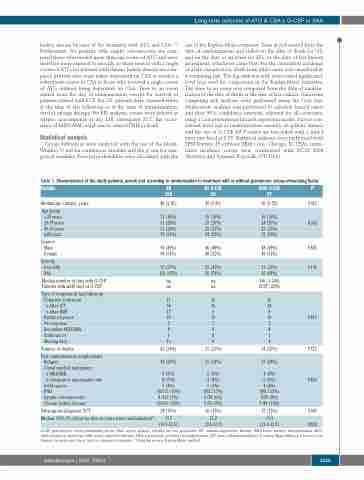
Table 1. Characteristics of the study patients, overall and according to randomization to treatment with or without granulocyte colony-stimulating factor.
Variable
Median age (range), years
Age group
- <20 years - 20-39 years - 40-59 years - ≥60 years
Gender
- Male
- Female
Severity
- Very SAA - SAA
Median number of days with G-CSF Patients with ≥240 days of G-CSF
Type of response at last follow-up - Complete remission
oAfterIST
oAfterBMT
- Partial response
- No response
- Secondary MDS/AML - Solid cancer
- Missing data
Number of deaths
Post-randomization complications - Relapse
- Clonal myeloid malignancy
o MDS/AML
o Cytogenetic abnormality only - Solid cancer
- PNH
- Aseptic osteonecrosis
- Chronic kidney disease
Subsequent allogeneic SCT
Median (95% CI) follow-up time in years since randomization*
All 192
46 (2-81)
31 (16%) 51 (26%) 51 (26%) 59 (31%)
94 (49%) 98 (51%)
70 (37%)
P
0.322
0.362
0.883
0.191
-
0.815
0.723
0.824
0.380 0.892
122
(63%)
na na
With G-CSF 97
50 (2-78)
16 (16%) 24 (25%) 22 (23%) 35 (36%)
48 (49%) 49 (51%)
31 (32%)
66 (68%)
160 (1-544) 21/97 (22%)
No G-CSF 95
41 (9-80)
15 (16%) 27 (28%) 29 (31%) 24 (25%)
46 (48%) 49 (52%)
39 (41%)
56 (59%)
na na
71
54
17
29 13 16
36
32 44 01 94
35 26
28 9 8
5 8 1 13
65 (34%)
48 (26%)
9 (5%)
10 (5%)
7 (4%) 18/113 (16%) 8 /113 (7%) 12/101 (12%)
28 (15%)
11.7
(10.9-12.5).
31 (33%)
21 (24%)
5 (5%)
4 (4%)
3 (3%) 9/52 (17%) 3 /54 (6%) 5 /53 (9%)
16 (17%)
11.2
(9.6-12.7)
34 (35%)
27 (28%)
4 (4%)
6 (6%)
4 (4%) 9/61 (15%) 5/59 (8%) 7 /48 (15%)
12 (12%)
11.9
(11.0-12.9)
G-CSF: granulocyte colony-stimulating factor; SAA: severe aplastic anemia; na: not applicable; IST: immunosuppressive therapy; BMT: bone marrow transplantation; MDS: myelodysplastic syndrome; AML: acute myeloid leukemia; PNH: paroxysmal nocturnal hemoglobinuria; SCT: stem cell transplantation. P values: Mann-Whitney U test for con- tinuous variables and the χ2 test for categorical variables. *Using the reverse Kaplan-Meier method.
haematologica | 2020; 105(5)
1225
