
Page 59 - Haematologica May 2020
P. 59
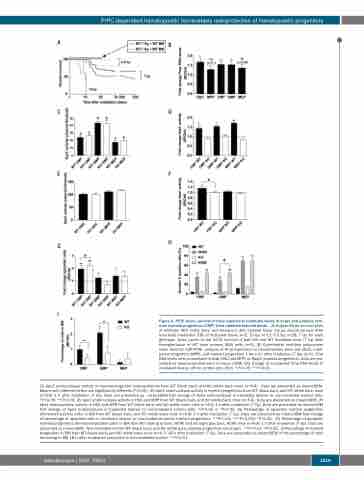
PrPC-dependent hematopoietic homeostasis radioprotection of hematopoietic progenitors
   A
B
CD
EF
G
I
H
Figure 2. PrPC favors survival of mice exposed to moderate doses of γ-rays and protects com- mon myeloid progenitors (CMP) from radiation-induced death. (A) Kaplan-Meier survival plots of wild-type (WT) (solid lines) and knock-out (KO) (dashed lines) mouse overall survival after total body irradiation (TBI) at indicated doses: n=5, 10 Gy; n=13, 6.5 Gy; n=28, 7 Gy; for each genotype. Arrow points to the 100% survival of both KO and WT irradiated mice (7 Gy) after transplantation of WT bone marrow (BM) cells (n=5). (B) Quantitative real-time polymerase chain reaction (qRT-PCR) analysis of Prnp expression in hematopoietic stem cell (HSC), multi- potent progenitor (MPP), and myeloid progenitors 1 hour (h) after irradiation (7 Gy) (n=6). Prnp RNA levels were normalized to Actb (HSC and MPP) or Rplp0 (myeloid progenitors). Data are pre- sented as mean±standard error of mean (SEM) fold change of normalized Prnp RNA levels in irradiated relative (IR) to control cells (Ctrl). *P<0.05; **P<0.01.
    (C) Ape1 endonuclease activity in myeloid progenitor subpopulations from WT (black bars) and KO (white bars) mice (n=5-8). Data are presented as mean±SEM. Means with different letters are significantly different (P<0.05). (D) Ape1 endonuclease activity in myeloid progenitors from WT (black bars) and KO (white bars) mice (n=5-8) 1 h after irradiation (7 Gy). Data are presented as mean±SEM fold change of Ape1 endonuclease in irradiated relative to non-irradiated control cells. *P<0.05; **P<0.01. (E) Ape1 endonuclease activity in HSC and MPP from WT (black bars) and KO (white bars) mice (n=5-8). Data are presented as mean±SEM. (F) Ape1 endonuclease activity in HSC and MPP from WT (black bars) and KO (white bars) mice (n=4-5) 1 h after irradiation (7 Gy). Data are presented as mean±SEM fold change of Ape1 endonuclease in irradiated relative to non-irradiated control cells. *P<0.05 or #P<0.05. (G) Percentage of apoptotic myeloid progenitors (AnnexineV-positive cells) in BM from WT (black bars) and KO (white bars) mice (n=6-8) 1 h after irradiation (7 Gy). Data are presented as mean±SEM fold change of percentage of apoptotic cells in irradiated relative to non-irradiated control myeloid progenitors. **P<0.01; ***P<0.001; #P<0.05. (H) Percentage of apoptotic myeloid progenitors (AnnexineV-positive cells) in BM from WT (dark gray bars, WTIR) and KO (light gray bars, KOIR) mice (n=6-8) 1 h after irradiation (7 Gy). Data are presented as mean±SEM. Non-irradiated control WT (black bars) and KO (white bars) myeloid progenitors are shown. **P<0.01; #P<0.05. (I) Percentage of myeloid progenitors in BM from WT (black bars) and KO (white bars) mice (n=6-7) 18 h after irradiation (7 Gy). Data are presented as mean±SEM of the percentage of cells remaining in BM 18 h after irradiation compared to non-irradiated control. **P<0.01.
   haematologica | 2020; 105(5)
1219
