
Page 58 - Haematologica May 2020
P. 58
C. Siberchicot et al.
age of HSC in BM, decreased HSC self-renewal, and accu- mulation of DNA damage.27 As PrPC has been implicated in HSC self-renewal25 and in DNA repair,21 we investigated the effect of PrPC loss in HSC numbers and DNA repair capacity during aging in Prnp+/+ and Prnp-/- mice. Prnp mRNA level in HSC was 2.7-fold higher in 11-month old
compared to 3-month old mice (Figure 1H) but did not change in MPP (Figure 1H). BM from 11-month old WT and KO mice displayed similar cellularity (Online Supplementary Figure S1E). As in 3-month old mice, a lower frequency of myeloid progenitors but not MPP (Figure 1I) was found in 11-month old KO mice (Online
ABC
DE
FG
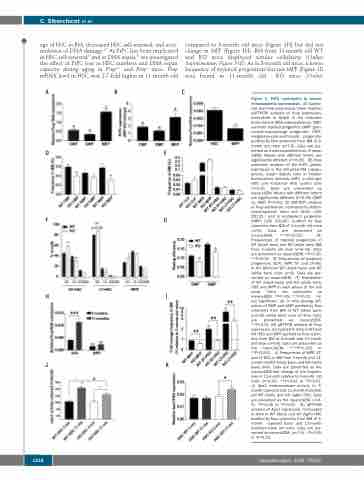
Figure 1. PrPC contributes to mouse hematopoietic homeostasis. (A) quanta- tive real-time polymerase chain reaction (qRT-PCR) analysis of Prnp expression, normalized to Rplp0 in the indicated bone marrow (BM) subpopulations: CMP: common myeloid progenitor; GMP: gran- ulocyte-macrophage progenitor; MEP: megakaryocyte-erythrocyte progenitor purified by flow cytometry from BM of 3- month old mice (n=7-9). Data are pre- sented as mean±standard error of mean (SEM). Means with different letters are significantly different (P<0.05). (B) Flow cytometry analysis of the PrPC protein expression in the indicated BM supopu- lations. Graph depicts ratio of median fluorescence intensity (MFI) in wild-type (WT) and knock-out (KO) control cells (n=5-6). Data are presented as mean±SEM. Means with different letters are significantly different (P<0.05) (CMP vs. MEP, P=0.06). (C) qRT-PCR analysis of Prnp expression, normalized to Actb in hematopoietic stem cell (HSC) (LSK CD135–) and in multipotent progenitor (MPP) (LSK CD135+) purified by flow cytometry from BM of 3-month old mice (n=9); Data are presented as mean±SEM. ***P<0.001. (D) Frequencies of myeloid progenitors in WT (black bars) and KO (white bars) BM from 3-month old mice (n=6-10). Data are presented as mean±SEM. *P<0.05; **P<0.01. (E) Frequencies of lymphoid progenitors (CLP), MPP, ST- and LT-HSC in the BM from WT (black bars) and KO (white bars) mice (n=6). Data are pre- sented as mean±SEM. (F) Distribution of WT (black bars) and KO (white bars) HSC and MPP in each phase of the cell cycle. Data are presented as mean±SEM. *P<0.05; **P<0.01. ns: not significant. (G) In vitro plating effi- ciency of CMP and GMP purified by flow cytometry from BM of WT (black bars) and KO (white bars) mice (n=6-9). Data
HI
JK
are presented as
**P<0.01. (H) qRT-PCR analysis of Prnp expression, normalized to Actb in WT and KO HSC and MPP purified by flow cytom- etry from BM of 3-month and 11-month old mice (n=6-9). Data are presented as the mean±SEM. ***P<0.001 or ###P<0.001. (I) Frequencies of MPP, ST- and LT-HSC in BM from 3-month and 11- month old WT (black bars) and KO (white bars) mice. Data are presented as the mean±SEM fold change of the frequen- cies in 11-month relative to 3-month old mice (n=6-10). **P<0.01 or ##P<0.01. (J) Ape1 endonuclease activity in 3- month (opened) and 11-month (hatched) old WT (dark) and KO (light) HSC. Data are presented as the mean±SEM. (n=4- 5). *P<0.05 or #P<0.05. (K) qRT-PCR analysis of Ape1 expression, normalized to Actb in WT (dark) and KO (light) HSC purified by flow cytometry from BM of 3- month (opened bars) and 11-month (hatched bars) old mice. Data are pre- sented as mean±SEM. (n=7-9). *P<0.05 or #P<0.05.
mean±SEM.
1218
haematologica | 2020; 105(5)
