
Page 48 - Haematologica May 2020
P. 48
H. Li et al.
(Figure 2C). Furthermore, although not significant, both percentages and absolute numbers of transplantable CD34+CD90+ cells were reduced when CD34+ cells were co-cultured on EGR1 knockdown stromal cells (1.76±0.76 fold for shEGR1 vs. 2.64±1.47 fold for scramble control compared with no stroma control), whereas the produc- tion of CD34+CD90+ cells was significantly increased with EGR1 over-expressing stroma feeder cells (6.97±4.53-fold) compared to controls (3.11±2.65-fold) (Figure 2D). Accordingly, transplantation into NSG mice demonstrated that CB CD34+ cells expanded on EGR1 over-expressing stroma exhibited higher long-term in vivo reconstitution levels with stable lymphoid and myeloid lineage engraftment compared with controls and EGR1 knockdown feeder cells (Figure 2E-G). These data therefore clearly indicated that EGR1 expression regulates the hematopoietic stroma support function of BM stro- mal cells.
EGR1-induced enhanced hematopoietic support is mediated through soluble factors and cell-cell interaction
Cord blood CD34+ expansion experiments using transwell cultures showed that numbers and percentages of ex vivo expanded CD34+ cells and CD34+CD90+ as well as total nucleated cells were reduced in all transwell co- cultures compared to stroma-contact conditions (Figure 3A-C and Online Supplementary Figure S3). Reductions were even more drastic in cultures stimulated with condi- tioned media from EGR1 knockdown and over-express- ing cell cultures, respectively, instead of feeder cells. Numbers of total CD34+ and CD34+CD90+ cells generat- ed were highest in the EGR1 overexpression groups, both in standard and transwell co-cultures, but also in non- stroma cultures stimulated by conditioned medium col- lected from EGR1 over-expressing stromal cells. These data thus indicated that EGR1 effects were both cell-cell contact and soluble factor-mediated, and confirmed the role of EGR1 in hematopoietic support regulation.
Stromal EGR1 induces expression of hematopoietic supporting genes that contribute to preserve primitive phenotype of CD34+ cells
To further explore the mechanism of EGR1-mediated hematopoiesis support, an array-based gene expression analysis was performed comparing EGR1 cells and control cells. In total, 189 genes were significantly up-regulated in EGR1 over-expressing cells, including genes involved in signal transduction, as well as adhesion molecule and cytokine genes (Online Supplementary Table S1 and Online Supplementary Figure S4A). Six of the up-regulated genes (CCL28, VCAM1, TIMP3, TNC, ENPP2 and MFAP4) (Figure 4A) have been reported to be genes supporting hematopoiesis,9-14 and we chose to further investigate CCL28 and VCAM1 as representatives for soluble factors and surface expressed, cell-cell contact mediating mole- cules, respectively.
First, CCL28 levels secreted by stromal cells in culture were assessed. CCL28 levels were higher in cultures with EGR1 over-expressing cells compared to controls (Figure 4B). Exogenous CCL28 enhanced the expansion of func- tional progenitor cells in co-cultures with EGR1 knock- down stroma feeder cells (Figure 4D-F and Online Supplementary Figure S4B-D). Furthermore, ex vivo expan- sion of CD34+ and CD34+ CD90+ cells in co-culture with EGR1 over-expressing stroma was dramatically inhibited by CCL28 blocking antibody in both standard medium and cytokine-free conditions (Figure 4G-I and Online Supplementary Figure S4E-G).
VCAM1 was slightly up-regulated in EGR1 over- expressing cells (Figure 4C). Functionally, the production of CD34+ and CD34+CD90+ cells in EGR1 over-expressing BMSC co-cultures was dramatically reduced when VCAM1 was blocked by a neutralizing antibody. Expansion rates were further reduced when CCL28 and VCAM1 blocking antibodies were used concurrently (Figure 4G-I and Online Supplementary Figure S4E-G).
Taken together, these data indicated that EGR1 overex- pression enhanced BMSC stroma supporting capacity and,
AB
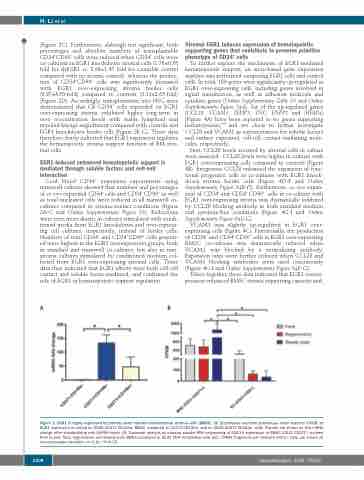
Figure 1. EGR1 is highly expressed by primary bone marrow mesenchymal stromal cells (BMSC). (A) Quantitative real-time polymerase chain reaction (rtPCR) of EGR1 expression in sorted lin–CD45–CD271+CD140a– BMSC compared to CD271+CD140a+ and lin–CD45–CD271–CD140a– cells. Results are shown as fold mRNA change after standardizing with GAPDH levels. (B) Transcript analysis by massive parallel RNA sequencing of EGR1-4 expression in BMSC (CD31–CD271+) isolated from human fetal, regenerative and steady-state BMSC compared to CD31+CD9+ endothelial cells (EC). FPKM: fragments per kilobase million. Data are shown as mean±standard deviation, n=3-10. *P<0.05.
1208
haematologica | 2020; 105(5)
