
Page 166 - Haematologica May 2020
P. 166
V. Agnusdei et al.
AB
C
D
E
vs. vs.
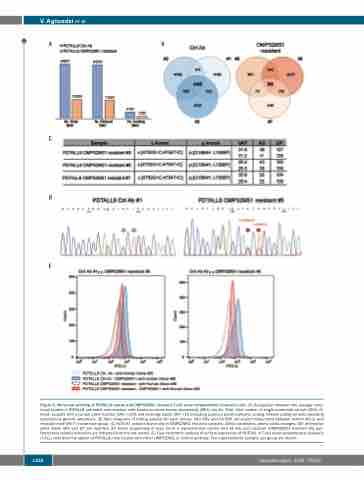
Figure 6. Molecular profiling of PDTALL8 control and OMP52M51 resistant T-cell acute lymphoblastic leukemia cells. (A) Comparison between the average muta- tional burden in PDTALL8 untreated and resistant cells based on whole exome sequencing (WES) results. Total: total number of single-nucleotide variant (SNV); fil- tered: variants with a variant allele fraction (VAF) >10% and coverage depth (DP) >30 excluding common polymorphisms; coding: filtered coding variants excluding synonymous genetic alterations. (B) Venn diagrams of coding variants for each mouse. 440 SNV and 54 SNV are shared respectively between control (#1-3) and resistant mice (#5-7) inside each group. (C) NOTCH1 variants found only in OMP52M51 resistant samples. cDNA coordinates, amino acidic changes, VAF, alternative allele depth (AD) and DP are reported. (D) Direct sequencing of exon 26 in a representative control (Ctrl Ab #1) and resistant (OMP52M51 resistant #5) pair. Resistance-related mutations are indicated with the red arrows. (E) Flow cytometric analysis of surface expression of NOTCH1 in T-cell acute lymphoblastic leukemia (T-ALL) cells from the spleen of PDTALL8 mice treated with either OMP52M51 or control antibody. Two representative samples per group are shown.
1326
haematologica | 2020; 105(5)
