
Page 149 - Haematologica May 2020
P. 149
TARP as target in acute myeloid leukemia
AB
CD
EF
G
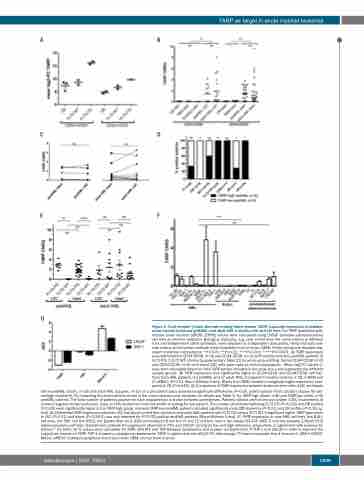
Figure 1. T-cell receptor γ chain alternate reading frame protein (TARP) transcript expression in pediatric acute myeloid leukemia (pedAML) and adult AML leukemic cells and cell lines. For TARP qualitative poly- merase chain reaction (qPCR), (CNRQ) values were calculated using LNCaP (prostate adenocarcinoma cell line) as interrun calibrator. Biological replicates, e.g. cells sorted from the same patient in different runs and independent cDNA syntheses, were depicted as independent data points. Horizontal bars indi- cate means and error bars indicate mean±standard error or mean (SEM). Horizontal square brackets rep- resent statistical comparisons; *P<0.05; **P<0.01; ***P<0.001; ****P<0.0001. (A) TARP expression was determined in CD34+CD38+ (n=4) and CD34+CD38– (n=3) cell fractions from four pedAML patients (2 FLT3-ITD, 2 FLT3 WT) (Online Supplementary Table S1) by micro-array profiling. Sorted CD34+CD38+ (n=3) and CD34+CD38- (n=2) cord blood (CB) cells were used as control populations. Mean log2-FC values (y- axis) were calculated based on both TARP probes included in the array, the x-axis represents the different sample groups. (B) TARP expression was significantly higher in CD34+CD38– and CD34+CD38+ cell frac- tions from AML patients (13 pedAML and 17 adult AML) compared to healthy controls (7 CB, 6 NBM and 2 mPBSC) (P<0.01, Mann Whitney U test). Blasts from NBM showed a marginally higher expression com- pared to CB (P=0.049). (C) Comparison of TARP expression between leukemic stem cells (LSC) and blasts
within pedAML (circles, n=10) and adult AML (squares, n=12) on a per patient basis showed no significant differences (P>0.05, paired sample t-test). (D) Bars display the per- centage of patients (%), harboring the characteristic shown in the x-axis (dichotomous variables, for details see Table 1), for TARP-high (black, n=8) and TARP-low (white, n=5) pedAML patients. The total number of patients positive for each characteristic is shown between parentheses. Patients without central nervous system (CNS) involvement all showed negative lumbar punctures. Data on CNS involvement and risk profile is lacking for one patient. The number of patients harboring FLT3-ITD (P<0.001) and HR profiles (P<0.05) were significantly higher in the TARP-high group, whereas TARP-low pedAML patients included significantly more CBF-leukemia (P<0.01) and SR profiles (P<0.05) (χ2 test). (E) Differential TARP expression between LSC and blasts sorted from pediatric and adult AML patients with FLT3-ITD versus FLT3 WT. A significant higher TARP expression in LSC (P<0.01) and blasts (P<0.0001) was only detected for FLT3-ITD positive pedAML patients (Mann Whitney U test). (F) TARP expression in nine AML cell lines, five B-ALL cell lines, the CML cell line K562, the Epstein-Barr virus (EBV)-immortalized B-cell line JY and T2 cell line, next to two breast (BT-474, MCF-7) and two prostate (LNCaP, PC3) adenocarcinoma cell lines. Dashed lines indicate the expression observed in PC3 and LNCaP, serving as low and high reference, respectively, in agreement with previous lit- erature.41 (G) Delta (d) Ct values were calculated for TARP, MALAT1 and TBP between cytoplasmic and nuclear compartments of THP-1 and LNCaP, in order to examine the subcellular location of TARP. THP-1 showed a cytoplasmic residence for TARP, in agreement with LNCaP. FC: fold change; FT: fusion transcript; Kas-1: Kasumi-1; MM-6: MONO- MAC6; mPBSC: mobilized peripheral blood stem cells; NBM: normal bone marrow.
haematologica | 2020; 105(5)
1309
