
Page 159 - Haematologica April 2020
P. 159
CD99 overexpression in AML
multiple hypotheses testing (unadjusted P=0.049).
CD99 expression was significantly lower (1.9-fold, P<0.001) in patients with mutated TP53 (n=15) compared with patients with TP53-WT (n=171) (Online Supplementary Figure S1O; Fisher's Exact test, P=0.0006, Online Supplementary Table S1). CD99 expression was not associated with other mutations (Online Supplementary
Table S2 and Online Supplementary Figure S2).
CD99 expression levels according to patients’ clinical characteristics
We dichotomized patients into high and low groups based on CD99 median expression. Patients with CD99- low had a significantly lower percentage of bone marrow (BM) blasts (median, 66.2 vs. 72.5, P=0.024), peripheral
blood (PB) blasts (median, 23.7 vs. 50.7, P<0.0001), and white blood cell (WBC) count (median, 27.7 vs. 45.8, P=0.019). The median age was 57.8 years in CD99-low and 52.1 years in CD99-high groups (Online Supplementary Table S3).
According to the National Comprehensive Cancer Network (NCCN), AML is classified into favorable, inter- mediate and poor-risk groups based on patients molecular and cytogenetic characteristics. CD99 expression was sig- nificantly higher in the favorable-risk group than that in the intermediate-risk (1.2-fold, P<0.01) and poor-risk (2- fold, P<0.0001) groups (Figure 2A). According to the AML French-American-British (FAB) classification data, patients with M5-AML had lower CD99 expression compared with M1, M2, M3 and M4 (Online Supplementary Figure
AB
CD
E
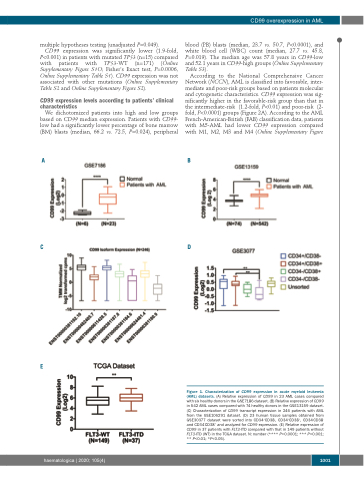
Figure 1. Characterization of CD99 expression in acute myeloid leukemia (AML) datasets. (A) Relative expression of CD99 in 23 AML cases compared with six healthy donors in the GSE7186 dataset. (B) Relative expression of CD99 in 542 AML cases compared with 74 healthy donors in the GSE13159 dataset. (C) Characterization of CD99 transcript expression in 246 patients with AML from the GSE106291 dataset. (D) 23 human tissue samples obtained from GSE30377 dataset were sorted into CD34+CD38-, CD34+CD38+, CD34-CD38- and CD34-CD38+ and analyzed for CD99 expression. (E) Relative expression of CD99 in 37 patients with FLT3-ITD compared with that in 149 patients without FLT3-ITD (WT) in the TCGA dataset. N: number (**** P<0.0001; *** P<0.001; ** P<0.01; *P<0.05).
haematologica | 2020; 105(4)
1001
