
Page 122 - Haematologica April 2020
P. 122
N. van Leeuwen-Kerkhoff et al.
A
B
C
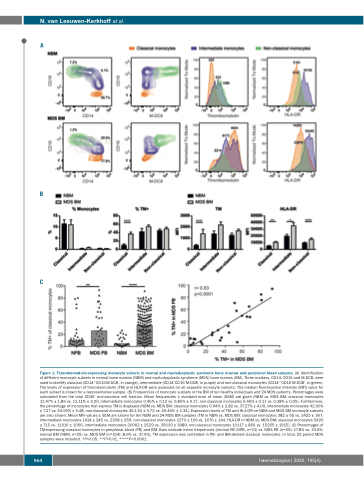
Figure 1. Thrombomodulin-expressing monocyte subsets in normal and myelodysplastic syndrome bone marrow and peripheral blood samples. (A) Identification of different monocyte subsets in normal bone marrow (NBM) and myelodysplastic syndrome (MDS) bone marrow (BM). Three markers, CD14, CD16 and M-DC8, were used to identify classical (CD14++CD16-M-DC8-, in orange), intermediate (CD14+CD16+M-DC8-, in purple) and non-classical monocytes (CD14+/-CD16+M-DC8+, in green). The levels of expression of thrombomodulin (TM) and HLA-DR were assessed on all separate monocyte subsets. The median fluorescence intensity (MFI) value for each subset is shown for a representative sample. (B) Frequencies of monocyte subsets in the BM of ten healthy individuals and 24 MDS patients. Percentages were calculated from the total CD45+ mononuclear cell fraction. Mean frequencies ± standard error of mean (SEM) are given (NBM vs. MDS BM: classical monocytes 11.47% ± 1.86 vs. 11.11% ± 2.20, intermediate monocytes 0.45% ± 0.12 vs. 0.85% ± 0.17, non-classical monocytes 0.46% ± 0.11 vs. 0.38% ± 0.05). Furthermore, the percentage of monocytes that express TM is displayed (NBM vs. MDS BM: classical monocytes 9.94% ± 2.82 vs. 37.27% ± 4.00, intermediate monocytes 42.60% ± 7.27 vs. 54.90% ± 3.48, non-classical monocytes 45.11% ± 3.72 vs. 49.46% ± 3.34). Expression levels of TM and HLA-DR on NBM and MDS BM monocyte subsets are also shown. Mean MFI values ± SEM are shown for ten NBM and 24 MDS BM samples (TM in NBM vs. MDS BM: classical monocytes 382 ± 65 vs. 1425 ± 367, intermediate monocytes 1414 ± 245 vs. 2208 ± 259, non-classical monocytes 1279 ± 169 vs. 1676 ± 144. HLA-DR in NBM vs. MDS BM: classical monocytes 5426 ± 715 vs. 11010 ± 1056, intermediate monocytes 20062 ± 2529 vs. 35639 ± 3989, non-classical monocytes 10117 ± 856 vs. 15255 ± 1915). (C) Percentages of TM-expressing classical monocytes in peripheral blood (PB) and BM. Bars indicate mean frequencies [normal PB (NPB, n=31) vs. MDS PB (n=29): 17.8% vs. 33.6%. normal BM (NBM, n=25) vs. MDS BM (n=154): 8.6% vs. 37.0%]. TM expression was correlated in PB- and BM-derived classical monocytes. In total, 25 paired MDS samples were included. *P<0.05, **P<0.01, ****P<0.0001.
964
haematologica | 2020; 105(4)
