
Page 76 - Haematologica March 2020
P. 76
G. Hernandez et al.
were enriched for cell cycle arrest, negative regulation of transcription, and regulation of cell proliferation categories (Figure 4E and Online Supplementary Table S4). Reinforcing these findings, gene set enrichment analysis identified sig- nificant (false discovery rate<0.1) enrichment of downreg- ulated genes related to mRNA translation initiation, elon- gation and termination in HSC from CIA mice (Online Supplementary Table S5), whereas only two gene sets were significantly enriched, both related to mitochondrial ribo- some function (Online Supplementary Table S6). The GEO
accession number for the RNA-sequencing data reported in this paper is GSE129511.
Using Fluidigm qRT-PCR to validate our RNA-sequenc- ing analyses, we found decreased expression of Myc, Mycn, Ccnd1 and Ccnd2, which are all required for HSC cell cycle entry (Figure 4F). Conversely, cyclin-dependent kinase inhibitors (CKI) Cdkn1a (p21) and Cdkn1c (p57), which enforce HSC quiescence, were significantly upreg- ulated in HSC from CIA mice (Figure 4G). In addition, Eif4b, which is required for Eif4a activity during mRNA
ABC
DE
F
GHI
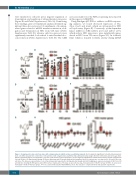
Figure 3. Hematopoietic stem cells from mice with collagen-induced arthritis retain reconstituting capacity. (A-C) Long-term engraftment of purified hematopoietic stem cells (HSC) isolated from control mice (Ctrl) and mice with collagen-induced arthritis (CIA). (A) Experimental design. (B) Donor chimerism and (C) lineage distri- bution in peripheral blood of recipient mice over time (n=8 Ctrl and 7 CIA recipient mice). (D-F) Long-term engraftment of unfractionated bone marrow isolated from Ctrl and CIA mice. (D) Experimental design. (E) Donor chimerism and (F) lineage distribution in peripheral blood of recipient mice over time (n=10 Ctrl and 9 CIA recip- ient mice). The data are representative of one of two independent experiments. (G) Experimental design and (H-I) Fluidigm gene expression analysis of HSC from Ctrl and CIA mice showing (H) HSC genes and (I) HSC surface marker genes. The data are presented as log10 fold expression in CIA HSC versus Ctrl HSC. Ct values were normalized to Actb (n=8-16 per group). *P<0.05, as determined by the Mann-Whitney U-test. The data were compiled from two independent experiments.
590
haematologica | 2020; 105(3)
