
Page 273 - Haematologica March 2020
P. 273
Kinome profiling to target Multiple Myeloma
A
C
D
E
B
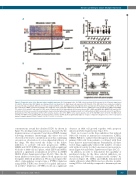
Figure 2. Prognostic value of the Kinome Index in multiple myeloma. (A) Clustergram in the 206 HM cohort’s patients (206 patients) of the 36 genes signal used
to build the Kinome Index (KI). Signals are displayed from low (deep blue) to high (deep red) expression. (B) Patients of the HM cohort were ranked according to increased KI and a maximum difference in OS was obtained with KI of 2.1 splitting patients into high-risk (31%) and low-risk (69%) groups (OS and EFS). (C) The KI was computed for MMC of patients belonging to the subgroups of the University of Arkansas for Medical Science (UAMS) molecular classification of MM, using UAMS- TT2 cohort. CD1: cyclin D1 and cyclin D3; CD2: cyclin D1 and cyclin D3; HY: hyperdiploid; LB: low bone disease; MF: c-MAF and MAFB; MS: MMSET; MY: myeloid; PR: proliferation; D) KI is increased in Pre-plasmablasts characterized by high proliferation during normal B- to PC-differentiation. MBC: memory B cells (n=5); prePB: pre- plasmablast (n=5); PB: plasmablast (n=5); LLPC: long live plasma cells (n=5); BMPC: bone marrow plasma cells (n=5); HM MM cohort (n=206); TT2 MM cohort (n=345); TT3 MM cohort (n=158); HMCL: human myeloma cell lines (n=44). (E) KI is significantly higher at relapse compared to diagnosis in a cohort of 23 paired patient’s samples (paired T-Test). P-value: *<0.05; **<0.01; ***<0.001.
concentrations around the calculated IC50. As shown in Figure 3C, all drugs induced apoptosis as measured by the dramatic increase of annexin V and cleaved PARP staining following treatment. Interestingly, this effect was not observed at the lower concentration used, thus confirming our previous observation of a dose-dependent efficacy of the drugs. We then tested the ability of the kinase inhibitors to perturb cell-cycle progression. CHK1i, MELKi and CDC7-DBF4i are associated with a significant blockade of MM cells in S phase, while PLK4i and MPS1i induced a significant accumulation in G0/G1 in AMO1 HMCL (Online Supplementary Figure S6A-B). Thus, the dif- ferent inhibitors tested here induced both apoptosis and deregulate MM cell proliferation. We also investigated the effect of phosphatase receptor type γ (PTPRG) depletion using siRNA. PTPRG was shown to be spiked and mutat- ed in MM.24 Depletion of PTPRG results in a significant
decrease in MM cell growth together with apoptosis induction (Online Supplementary Figure S15).
Next, we focused on the three inhibitors that induced MM cells toxicity at nanomolar concentration (CHK1i; MELKi; PLK4i) to validate their therapeutic interest using primary MM cells from patients co-cultured with their bone marrow microenvironment. Remarkably, all three tested drugs significantly reduced the number of tumor cells without toxicity for the bone marrow microenviron- ment (Figure 4A and Online Supplementary Figure S6C-E).
In addition, in order to demonstrate the capability of preclinical studies for the three selected inhibitors, we tested them in 5T33v cells, a murine model of MM.17 As shown in Figure 4B, CHK1i and MELKi demonstrated similar efficiency while PLK4i was less effective in influ- encing 5T33vv cell viability compared to human myeloma cells.
haematologica | 2020; 105(3)
787
