
Page 272 - Haematologica March 2020
P. 272
H. de Boussac et al.
AC
B
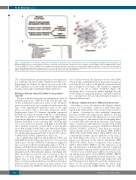
Figure 1. Identification of 36 kinome related probe sets linked to prognosis in three independent cohorts of newly diagnosed multiple myeloma patients. (A) Workflow analysis used to identify kinases with gene expression associated with a prognostic value in muliple myeloma (MM). Cohort 1: HM-Montpellier cohort, Cohort 2: UAMS-TT2, Cohort 3: UAMS-TT3. Poor prognosis means that high gene expression is associated with a significant negative outcome, while good prognosis means that high gene expression is linked to a better outcome (B) Reactome molecular signatures significantly enriched in the kinases related to a poor outcome in MM (C) String network of the 36 identified kinases. Red color represents cell cycle related kinases.
TK1), which exhibited a specific pattern of overexpression in a subgroup of patients (Online Supplementary Figure S1). Interestingly 10 of these 14 kinases are part of the CIN- SARC signature, associated with chromosomal instability in many cancer types including multiple myeloma.19
Building a Kinome Index (KI) linked to the patient’s outcome
We next combined the prognostic information of the 36 identified kinases in a GEP-based a KI. This KI is the sum of the standardized expression value of the 28 kinase genes associated with a poor prognostic value minus the sum of the standardized expression value of the eight genes associated with a favorable prognosis (Online Supplementary Figure S2). Maxstat algorithm segregated the HM cohort into two groups with 31% of the patients with a KI>2.1 and 69% of the patients with a KI≤2.1 with a maximum difference in overall survival (OS) (Figure 2A). Patients with KI>2.1 have a median OS of 50.6 months versus not reached for patients with KI≤2.1 (P=1,7E-05)) and a median event free survival (EFS) of 20.1 months versus 40.6 months (P=4,5E-05) in the HM cohort (Figure 2B). The prognostic value of the KI was validated in the two additional independent UAMS-TT2 and TT3 cohorts for OS and EFS (Online Supplementary Figure S3).
KI is significantly higher in the proliferation (PR) and MAF MM molecular subgroups20 known to be associated with a poor outcome (P<8E-18). Furthermore, higher KI was associated with the proliferating stages of B-cell to plasma-cell differentiation including activated B cells, pre- plasmablasts and plasmablasts compared to non-prolifer- ating memory B cells and mature plasma cells (Figure 2D). This observation corroborates the association of the 36 kinases to cell cycle (Figure 1B) and the PR subgroup (Figure 2C), as well as the well-known association of kinase activation with proliferation. In addition, KI values increased with disease progression from normal bone marrow plasma cells (BMPC) to MM cells with a homoge-
neous index between the different cohorts tested (HM, TT2 and TT3) and HMCL (P<0.01) (Figure 2D). Finally, we tested the KI in a cohort of 23 patients with paired sam- ples at diagnosis and relapse, and identified a significant increase of the KI at relapse (P=4E-04) (Figure 2E). Altogether these observations further highlight that the selected kinases comprising markers of genomic instabili- ty,19 could represent new potential therapeutic targets for high-risk MM patients.
KI kinases’ inhibition leads to MM cell death in vitro According to our in silico analysis, the 36 genes demon- strated an outstanding connection with MM phys- iopathology and prognosis. Thus, we next assessed select- ed kinases of interest for their individual therapeutic potential on MM cells using specific inhibitors. For that purpose we first excluded the eight genes associated with favorable prognosis, and analysed the 28 remaining kinas- es for their link with MM in the literature. Three genes whose connections with MM have already been widely studied (more than five references identified in PubMed) (CKS1B21; AURKA22; CDKN2C)23 were then also excluded, and we finally selected the seven kinases (PBK; CHEK1; MPS1/TTK; CDC7-DBF4; MELK; PLK4; SRPK1) that had commercially available specific inhibitors at the time of the study (Figure 3A). It has to be note that all selected kinases are involved in the mitotic checkpoint (PBK; MPS1/TTK; MELK; PLK4) or replicative stress response (CHK1; CDC7-DBF4; SRPK1), and the expression of all the selected kinases is individually correlated to high-risk KI-defined MM subgroup (Online Supplementary Figure S4). Then we assessed the kinase inhibitors for their poten- tial anti-myeloma effect on four HMCL (AMO-1, OPM2, XG-1 and XG-21). Remarkably all tested drugs led to a sig- nificant decrease in HMCL viability and cell growth, with an IC50 indicated in Figure 3B and Online Supplementary Figure S5. We next investigated how the tested drugs impact cell death in the AMO1 HMCL using two drugs
786
haematologica | 2020; 105(3)
