
Page 164 - Haematologica March 2020
P. 164
M. Xu et al.
AB
C
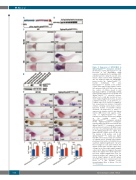
Figure 2. Expression of hBCR/ABL1 in Tg(hsp70:p210BCR/ABL1) transgenic zebrafish. (A) Structure of pToL hsp70:p210BCR/ABL1. (B) Detection of the hBCR/ABL1 cDNA
D sequence integrated into the wild-type (WT) zebrafish genome using the specific poly- merase chain reaction (PCR) amplifying a 466 bp fragment within the hBCR/ABL1 fusion section. Tg: Tg(hsp70:p210BCR/ABL1)
founder individuals; PC: hsp70:p210BCR/ABL1 plasmid as the positive control; NC1: ddH2O as the negative control; NC2: genomic DNA of WT fish as the nega- tive control. (C) Whole mount in situ hybridization (WISH) of hBCR/ABL1 mRNA temporospatial expression in 3 dpf WT and Tg(hsp70:p210BCR/ABL1) zebrafish embryos without (a-f) or with (g-l) heat-shock treat- ment. Original magnification x32 (a, d, g and j). Signals in head (b, e, h, k) and tail (c, f, i, l) region under 100× and 200× magnifica- tion, respectively. n/n: number of zebrafish embryos showing representative pheno- type/total number of zebrafish embryos examined. (D) Expression of p210BCR/ABL1 expressed in embryos (n=200) and kidney marrow (KM) blood cells (approx. 2x10⁶ cells) of Tg(hsp70:p210BCR/ABL1) adult zebrafish assessed by western blot. GAPDH as the loading control. Tg: Tg(hsp70:p210BCR/ABL1) transgenic zebrafish; No-HS: TTg(hsp70:p210BCR/ABL1) transgenic zebrafish without heat-shock treatment; HS: Tg(hsp70:p210BCR/ABL1) transgenic zebrafish with heat-shock treatment. (E) WISH of lcp1 (a-b), lyz (c-d), and mfap4 (g-h) expressions in HS Tg(hsp70:p210BCR/ABL1) (right) were higher than WT controls (left) at 3 dpf. (e-f) The number of SB positive cells in HS Tg(hsp70:p210BCR/ABL1) (right) was higher than WT controls (left) at 3 dpf. n/n: number of zebrafish larvae showing representative phenotype/total number of zebrafish larvae examined. Original magnification ×32 (a-h). Red rectangles in each panel indicate the signals in PBI region and the regions were enlarged at the lower right (original magnifi- cation ×200). Black rectangles in the panel indicate the signals in the brain region (ver- tical view, original magnification ×50). (i-l) Statistical analysis. lcp1+ signals (i), lyz+ sig- nals (j), mfap4+ signals (l), and SB+ signals (k) in PBI region were calculated and com-
pToL
E
3 dpf. Student t-tests,
pared at
mean±Standard Error of Mean; *P<0.05; ****P<0.0001.
678
haematologica | 2020; 105(3)
