
Page 122 - Haematologica March 2020
P. 122
L. de Swart et al.
PFS was detected by sex (P=0.1), but PFS in females was superior in the multivariate analyses.
Progression-free survival using time-varying covariates proportional hazards regression analysis
Variables used for adjustment at baseline included age at diagnosis, sex, country of origin, number of cytopenias (and their corresponding blood counts), and number of units of blood received before registration. Time-varying variables measured longitudinally included: dose density, EQ-5D Index, components of the IPSS-R, and receipt of ESA, iron chelators and lenalidomide.
In multivariate analysis, not adjusting for the effects of ESA, iron chelation and lenalidomide therapy, all variables entered in the regression retained statistical significance. The functional form of the dose density effect (P<10-4) is shown in Figure 3B. With a frailty term added for the sub-
A
jects’ country of origin, all previously significant variables, including the dose density, retained statistical significance, with a dose density P-value of <10-4.
Impact of therapeutic interventions on red blood cell transfusion densities
Treatment with ESA, lenalidomide and iron chelators may improve erythropoiesis and reduce the need for RBCT. Reduction of the RBCT rate results in a gradual decrease of the subsequent RBCT dose densities in inter- vals during the response period. We therefore investigated how many of the transfused patients had been treated with these interventions and calculated the average treat- ment duration and the number of patients with reduced transfusion densities after starting the intervention. In our cohort of 1,267 patients, 679 received treatment with an ESA and 151 had reduced transfusion densities in the first
B
CD
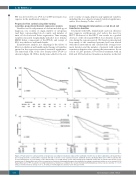
Figure 2. Progression-free survival and risk of progression according to transfusion status at the landmark of visit 3 (1 year after registration). (A) Kaplan-Meier plot of progression-free survival (PFS) of patients who did or did not receive transfusions by the landmark (visit 3). (B) Kaplan-Meier plot of PFS of patients who received transfusions at a low density (<0.87 units/month) or at a high density (>0.87 units/month) by the landmark versus PFS of patients who did not receive transfusions; (C) Kaplan-Meier plot of time to progression of patients surviving until progression subdivided according to transfusion burden or not as in panel B; (D) Kaplan-Meier plot of PFS of patients receiving transfusions at densities according to the revised International Working Group criteria: low dose density: >0- <0.75 units per month; mid dose density: 0.75 - 1.75 units per month; high dose density >1.75 units per month.
636
haematologica | 2020; 105(3)
