
Page 87 - 2020_02-Haematologica-web
P. 87
Securin controls hematopoietic progenitor function
involved in the regulation of the intra-S-checkpoint and regulation of the response of yeast to treatment with HU.16 Previously, a 3-11-fold overexpression of Pttg1 in var- ious D2 tissues compared to B6 was demonstrated.17-19 This renders Pttg1 a prime candidate quantitative trait gene in the interval on chromosome 11. To investigate whether the Pttg1 mediates the HU response, we analyzed its expression in our experimental mouse strains. We observed a 3-5-fold increase in gene and protein expres- sion in D2 or line A derived HSPC compared to the corre- sponding cells from B6 or line K mice (Figure 3B and C). A D2-allele of the locus thus confers elevated expression of Pttg1. Analyzing Pttg1-associated promoter and exon regions in silico revealed a 7 bp insertion downstream of the transcription start (NCBI Reference Sequence: NC_000077.6) in the D2 genome, potentially positively affecting binding of transcription factors (TF) (Online Supplementary Figure S3A). Since the occurrence of these D2- and A/J-specific 7 bp was previously reported to result in reduced Pttg1 expression in contrast to what we find in
D2 animals,20 we further determined the promoter struc- ture of Pttg1 in more detail by polymerase chain reaction (PCR) of genomic DNA. Surprisingly, the Pttg1 promoter region was present in two differently sized versions (the two fragments differ in size by approx. 700 bp) in D2 and line A mice (Figure 3D). DNA sequencing revealed that the short version in D2 (D2_1) was identical to the B6 Pttg1 promoter, while the longer version (D2_2) was unique to D2 and included the already described 7 bp insertion in addition to an additional 675 bp region between the tran- scription and the ORF start, which is not completely anno- tated in common genome databases at the present time in contrast to the 7 bp insertion (Online Supplementary Figure S3B and C). This could imply a likely gene duplication of Pttg1 within the congenic locus. We next tested whether the distinct types of promoter regions are causative for the dissimilar Pttg1 expression patterns. By applying a dual- specific luciferase assay, we observed an almost 3-fold increase in activity of the D2_2-specific promoter com- pared to the B6 and the shorter D2_1 variants, suggesting
AB
C
D
E
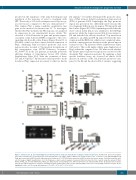
Figure 3. Chromosome 11 associated Pttg1 has an altered promotor sequence in D2/A mice leading to enhanced expression. (A) Mean life span (left) or hydrox- yurea (HU) sensitivity rates of hematopoietic stem and progenitor cells (HSPC) (right) of BXD mouse strains relative to the occurrence of the SNP D11Mit174. (B) Pttg1 gene expression in HSPC from the indicated mouse strains. n=3. (C) PTTG1 protein expression in HSPC from the four mouse strains. (Left) Representative west- ern blot images. (Right) Quantification. n=3. (D) Polymerase chain reaction analysis of genomic DNA from lines B6, D2, A and K using the primers 5’NheI- B6/D2_PTTG1_pr1 and 3’EcoRV-B6/D2_PTTG1_pr2. Major bands corresponding to the different promotors are indicated with arrows. (E) Dual-specific luciferase assay for the indicated promotor constructs, including a negative (pNL1.1[Nuc]) and a positive (pNL1.1[CMV]) control. The corresponding constructs to Figure 3D are highlighted in blue. n=3 (3 rounds with triplicates). *P<0.05; **P<0.01; ****P<0.0001.
haematologica | 2020; 105(2)
321
