
Page 86 - 2020_02-Haematologica-web
P. 86
A. Brown et al.
among these groups, even when regarding S-phase specif- ic apoptosis rates as well senescence in response to HU as indicated by the level of the senescence marker p16 in HSPC (Figure 2D and Online Supplementary Figure S2E and F). In addition, whereas HU treatment almost completely blocks BrdU incorporation, LK cells from all strains pre- serve their ability to re-enter active S-phase in a locus- independent manner 3 and even 16 hours (h) after HU is removed, excluding the possibility that enhanced levels of senescence, apoptosis or difference in re-initiation of repli- cation after stalling are causative for the HU sensitivity phenotype (Figure 2E and Online Supplementary Figure S2G). Similarly, LK cells from all strains showed compara- ble frequencies of gH2AX foci per cells upon HU treat- ment and 3 h post HU removal, which also excludes a role of variation in stalling of replication and the subsequent
DNA damage for our phenotype (Figure 2F). In aggrega- tion, these data exclude a likely contribution of differences in cell cycle and replication parameters as well as differen- tial senescence or apoptosis to the highly unequal HU sus- ceptibilities of HSPC in the inbred and congenic strains, while the underlying mechanism still remains to be iden- tified.
A D2-allele at the genetic microsatellite marker D11Mit174 (Chr.11:42,593,949-42,594,095, which is with- in the area with the highest level of linkage) correlated in the BXD RI set, as anticipated, with higher HU-suscepti- bility rates of HSPC and a lower mean life span (Figure 3A). The gene Pttg1 (Securin), which has been reported to inhibit mitotic division,13,14 is located in very close proxim- ity (+ 800 kB) to D11Mit174.15 In addition, the yeast homolog of Securin, Pds1p, was reported to be critically
A
P=0.10 B
P=0.07
CD
E
F
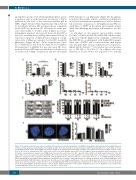
Figure 2. The chromosome 11 locus controls sensitivity of hematopoietic stem and progenitor cells (HSPC) to hydroxyurea (HU) exposure but not HSPC frequency, cell cycle activity, apoptosis and replication fork stalling. (A) Mice from all four groups were injected with 10 mg HU/kg body weight or its solvent (PBS) for 1 hour (h) following isolation of bone marrow (BM) cells and processing for the cobblestone area-forming cell (CAFC) assay. Shown is the fraction of HSPC sensitive to HU. n=5-12. (B) Cell cycle distributions of HSPC (left), Lin-Sca1+cKit+ cells (LSK) (middle) and Lin–cKit+ cells (LK) (right) of bromodeoxyuridine (BrdU)-treated mice. n=4. (C) Relative low density bone marrow cells (LDBM) frequencies per tibia and femur of Lin–cKit+ cells (LK), Lin-Sca1+cKit+ cells (LSK) and hematopoietic stem cells (HSC) of the four mouse strains. n=4. (D) (Left) LDBM cells from the four strains were treated with HU or its solvent (PBS) for 1 h. Thereafter, LK cells (left) and HSC (right) were analyzed in terms of apoptosis (AnnexinV). n=4. (E) LDBM cells were either treated with a control (-HU), HU for 1 h or accordingly following HU removal (RV) by washing twice with medium and an additional resting period of 3 h (+HU RV). Thirty minutes prior to staining, all samples were co-cultured with BrdU. (Left) Representative BrdU/7AAD FACS plots of LK cells from the indicated strains. (Right) Quantification of LK cell cycle distribution. n=3. (F) LK cells from all four mouse strains were either treated with a control, HU for 1 h or accordingly following HU RV and an additional resting period of 3 h (+HU RV). Thereafter, cells were harvested and stained against gH2AX. (Left) Representative confocal images. (Right) Quantification of the number of gH2AX foci per cell. n=3. Significances are related to the corresponding -HU controls. *P<0.05; **P<0.01; ***P<0.001; ****P<0.0001.
320
haematologica | 2020; 105(2)
