
Page 108 - 2020_02-Haematologica-web
P. 108
R. Huisjes et al.
dehydrated, based on the Ohyper measurements (Figure 4C). In line with this, patients with mild HS showed higher MCHC values than moderately/severely affected patients (Figure 4D) and had a higher density of the M fraction, based on this latter’s position within the Percoll gradient (Figure 4E, Online Supplementary Figure S2).
Based on reduced MPA, membrane loss was more pro- nounced in patients with moderate/severe HS (Figure 4F). In line with this, the number of RBC vesicles detect- ed in the plasma of patients with moderate/severe HS was higher than that in patients with mild HS (Figure 4G). However, no difference in EMA staining was observed between patients with mild or moderate/severe HS (Figure 4C). Intercellular hetero- geneity (RDW and MPA DW) was increased in patients with moderate/severe HS compared to those with mild HS and healthy controls (Figure 4I, J).
In summary, the RBC of patients with more severe expression of the disease had a reduced lifespan and less stable membrane. Their cells were smaller and more heterogeneous in size and density. Strikingly, patients with mild HS had denser RBC with higher MCHC (Figure 4D, E).
Effect of splenectomy on red blood cell markers of disease severity
Performed in patients with moderate/severe HS,
splenectomy results in an increase in hemoglobin levels and erythrocyte counts (data not shown). In our cohort splenectomy was also associated with a decrease in RDW (Figure 5A) and normalization of RBC morphology (Online Supplementary Figures S3 and S4). The survival of RBC from splenectomized HS patients, as assessed by HbA1c content or band 4.1a:b ratio, was found to be increased (Figure 5B, C).
Several parameters remained unaffected by splenecto- my. Splenectomy did not alter MCHC (Figure D) or intra- cellular K+ levels (Figure 5E) and did not correct band 3 loss (Figure 5F). It also did not affect deformability (no effect on Elmax or Ohyper) (Figure 5G, H). However, the cells did sur- vive for a longer time in the circulation despite an increase in osmotic fragility (Figure 5I).
Discussion
This comprehensive study in a well-characterized cohort of patients offers insight into the variable pheno- typic manifestations of HS, possible causes of clinical het- erogeneity and severity, and the impact of splenectomy. We show here that strong markers of moderate/severe expression of HS are: (i) lower RBC density, reflected by differences in MCHC and fractionation of RBC on the Percoll density gradient; (ii) reduced RBC deformability
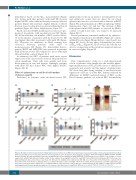
ABC
DEF
Figure 2. Red blood cell heterogeneity in hereditary spherocytosis. Red blood cell (RBC) heterogeneity was measured in healthy controls and patients with hereditary spherocytosis (HS) by microscopy (A, B) and Percoll density gradients (C-F). HS patients were grouped according to their affected genes [ANK1 (ankyrin), SLC4A1 (band 3), SPTB (β-spectrin) and SPTA1 (α-spectrin)]. (A) Mean projected area distribution width (MPA DW). (B) Mean projected area (MPA). (C) An example of a blood sample from a patient with HS and a healthy control. On the samples the young RBC fraction, the main RBC fraction (M fraction) and dense RBC fractions are des- ignated with green, blue and red lines, respectively. The M fraction is subdivided into subfractions (M1, M2, etc.). The position of the M fraction is calculated from the position of the most intense (n arbitrary units, a.u.) subfraction relative to the total length of the Percoll column. The HS patient has seven RBC subfractions, and the position of the most intense subfraction (i.e. subfraction M3) is lower than in the control subject (i.e. subfraction M1). (D) The number of subfractions in the RBC density gradient. (E) Fraction distribution width (%). (F) Position of the M fraction (%). Significant differences are noted: *P≤0.05, †P≤0.01 or ‡P≤0.001.
342
haematologica | 2020; 105(2)
