
Page 107 - 2020_02-Haematologica-web
P. 107
Phenotypic markers for hereditary spherocytosis
Patients with HS presented with greater heterogeneity in cell density compared with healthy subjects, showing more subfractions of the M fraction and a broader distri- bution width of the M fraction (Figure 2C-E). These changes were more pronounced in patients with muta- tions in ANK1 and SPTA1. Furthermore, the M fraction of patients with SLC4A1 mutations was lower than that of healthy controls or other HS patients (Figure 2F, Online Supplementary Figure S2).
In summary, specific changes were observed in param- eters associated with membrane stability, stiffness and deformability, as well as RBC heterogeneity in our cohort of HS patients.
Red blood cell markers of severity of hereditary spherocytosis
As described in Table 1, the severity of HS in non- splenectomized patients was determined based on the
decrease in hemoglobin concentration and increase in reticulocyte count.11 In our patients hemoglobin concen- tration correlated positively with MCHC (Figure 3A). Inverse correlations were observed between hemoglo- bin and RDW (Figure 3B), and between hemoglobin and reticulocyte count (Figure 3C). Furthermore, inverse cor- relations were observed between hemoglobin and parameters defining RBC hydration status such as intra- cellular K+ and Ohyper (Figure 3D, E).
Decreases in RBC lifespan were assessed by a reduc- tion in changes in HbA1c in non-splectomized patients with severe HS, whereas in patients with mild disease manifestations or in splenectomized patients HbA1c levels were within the normal range (Figure 4A).
Patients with moderate/severe HS had less deformable RBC, reflected by lower Elmax values, than patients with mild HS or splenectomized patients (Figure 4B). The RBC of patients with mild HS also tended to be more
ABC
DEF
GH
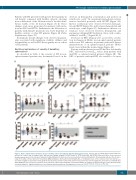
Figure 1. Basic characteristics (median ± range) of healthy controls and patients with hereditary spherocytosis. Patients with hereditary spherocytosis (HS) were grouped as a whole and according to their affected genes [ANK1 (ankyrin), SLC4A1 (band 3), SPTB (β-spectrin) and SPTA1 (α-spectrin)]. Blue circles represent healthy controls, black circles represent unsplenectomized HS patients and red circles represent splenectomized HS patients. The gray range indicates the reference range for healthy controls. (A) Eosin-5′-maleimide (EMA)-binding (%), (B) maximum deformability (EImax), (C) hydration state of the red blood cells reflected by Ohyper, (D) osmotic fragility measured by osmotic gradient ektacytometry and reflected by Omin, (E) 50% lysis point in the osmotic fragility test, (F) red blood cell distribution width (RDW) (percent coefficient of variation, %CV), (G) mean corpuscular hemoglobin concentration (MCHC) by capillary measurements (g/L) (%CV), (H) intracellular potassium (mmol/L). Significant differences are depicted with horizontal bars, and significance levels are noted: *P≤0.05, †P≤0.01 or ‡P≤0.001.
haematologica | 2020; 105(2)
341
